
A Look At The Intrinsic Value Of ChemoMetec A/S (CPH:CHEMM)
Key Insights
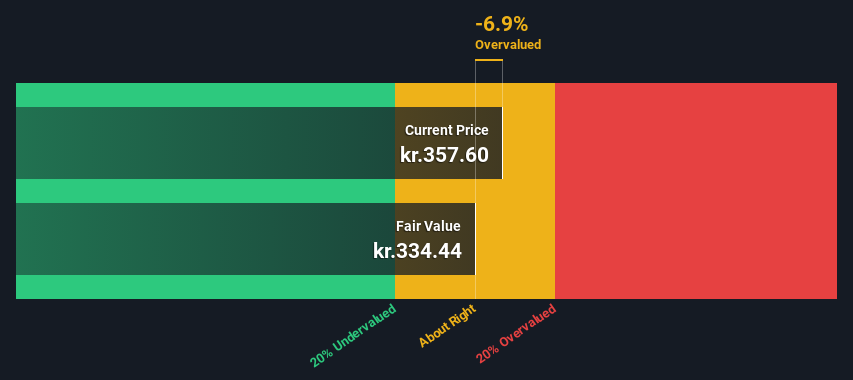
- The projected fair value for ChemoMetec is kr.334 based on 2 Stage Free Cash Flow to Equity
- With kr.358 share price, ChemoMetec appears to be trading close to its estimated fair value
- When compared to theindustry average discount of -24%, ChemoMetec's competitors seem to be trading at a greater premium to fair value
Does the September share price for ChemoMetec A/S (CPH:CHEMM) reflect what it's really worth? Today, we will estimate the stock's intrinsic value by taking the expected future cash flows and discounting them to today's value. We will use the Discounted Cash Flow (DCF) model on this occasion. Believe it or not, it's not too difficult to follow, as you'll see from our example!
We generally believe that a company's value is the present value of all of the cash it will generate in the future. However, a DCF is just one valuation metric among many, and it is not without flaws. Anyone interested in learning a bit more about intrinsic value should have a read of the Simply Wall St analysis model.
Check out our latest analysis for ChemoMetec
The Model
We're using the 2-stage growth model, which simply means we take in account two stages of company's growth. In the initial period the company may have a higher growth rate and the second stage is usually assumed to have a stable growth rate. In the first stage we need to estimate the cash flows to the business over the next ten years. Where possible we use analyst estimates, but when these aren't available we extrapolate the previous free cash flow (FCF) from the last estimate or reported value. We assume companies with shrinking free cash flow will slow their rate of shrinkage, and that companies with growing free cash flow will see their growth rate slow, over this period. We do this to reflect that growth tends to slow more in the early years than it does in later years.
A DCF is all about the idea that a dollar in the future is less valuable than a dollar today, so we need to discount the sum of these future cash flows to arrive at a present value estimate:
10-year free cash flow (FCF) estimate
| 2024 | 2025 | 2026 | 2027 | 2028 | 2029 | 2030 | 2031 | 2032 | 2033 | |
| Levered FCF (DKK, Millions) | kr.160.0m | kr.196.0m | kr.218.9m | kr.237.2m | kr.251.4m | kr.262.4m | kr.270.9m | kr.277.4m | kr.282.5m | kr.286.6m |
| Growth Rate Estimate Source | Analyst x1 | Analyst x1 | Est @ 11.69% | Est @ 8.35% | Est @ 6.00% | Est @ 4.37% | Est @ 3.22% | Est @ 2.41% | Est @ 1.85% | Est @ 1.46% |
| Present Value (DKK, Millions) Discounted @ 5.0% | kr.152 | kr.178 | kr.189 | kr.195 | kr.197 | kr.196 | kr.193 | kr.188 | kr.182 | kr.176 |
("Est" = FCF growth rate estimated by Simply Wall St)
Present Value of 10-year Cash Flow (PVCF) = kr.1.8b
The second stage is also known as Terminal Value, this is the business's cash flow after the first stage. For a number of reasons a very conservative growth rate is used that cannot exceed that of a country's GDP growth. In this case we have used the 5-year average of the 10-year government bond yield (0.5%) to estimate future growth. In the same way as with the 10-year 'growth' period, we discount future cash flows to today's value, using a cost of equity of 5.0%.
Terminal Value (TV)= FCF2033 × (1 + g) ÷ (r – g) = kr.287m× (1 + 0.5%) ÷ (5.0%– 0.5%) = kr.6.5b
Present Value of Terminal Value (PVTV)= TV / (1 + r)10= kr.6.5b÷ ( 1 + 5.0%)10= kr.4.0b
The total value is the sum of cash flows for the next ten years plus the discounted terminal value, which results in the Total Equity Value, which in this case is kr.5.8b. To get the intrinsic value per share, we divide this by the total number of shares outstanding. Relative to the current share price of kr.358, the company appears around fair value at the time of writing. The assumptions in any calculation have a big impact on the valuation, so it is better to view this as a rough estimate, not precise down to the last cent.
The Assumptions
Now the most important inputs to a discounted cash flow are the discount rate, and of course, the actual cash flows. If you don't agree with these result, have a go at the calculation yourself and play with the assumptions. The DCF also does not consider the possible cyclicality of an industry, or a company's future capital requirements, so it does not give a full picture of a company's potential performance. Given that we are looking at ChemoMetec as potential shareholders, the cost of equity is used as the discount rate, rather than the cost of capital (or weighted average cost of capital, WACC) which accounts for debt. In this calculation we've used 5.0%, which is based on a levered beta of 0.891. Beta is a measure of a stock's volatility, compared to the market as a whole. We get our beta from the industry average beta of globally comparable companies, with an imposed limit between 0.8 and 2.0, which is a reasonable range for a stable business.
SWOT Analysis for ChemoMetec
- Debt is not viewed as a risk.
- Earnings growth over the past year underperformed the Life Sciences industry.
- Expensive based on P/E ratio and estimated fair value.
- Annual earnings are forecast to grow faster than the Danish market.
- No apparent threats visible for CHEMM.
Moving On:
Valuation is only one side of the coin in terms of building your investment thesis, and it ideally won't be the sole piece of analysis you scrutinize for a company. It's not possible to obtain a foolproof valuation with a DCF model. Preferably you'd apply different cases and assumptions and see how they would impact the company's valuation. If a company grows at a different rate, or if its cost of equity or risk free rate changes sharply, the output can look very different. For ChemoMetec, there are three pertinent items you should assess:
- Risks: For example, we've discovered 2 warning signs for ChemoMetec (1 can't be ignored!) that you should be aware of before investing here.
- Future Earnings: How does CHEMM's growth rate compare to its peers and the wider market? Dig deeper into the analyst consensus number for the upcoming years by interacting with our free analyst growth expectation chart.
- Other Solid Businesses: Low debt, high returns on equity and good past performance are fundamental to a strong business. Why not explore our interactive list of stocks with solid business fundamentals to see if there are other companies you may not have considered!
PS. Simply Wall St updates its DCF calculation for every Danish stock every day, so if you want to find the intrinsic value of any other stock just search here.
Have feedback on this article? Concerned about the content? Get in touch with us directly. Alternatively, email editorial-team (at) simplywallst.com.
This article by Simply Wall St is general in nature. We provide commentary based on historical data and analyst forecasts only using an unbiased methodology and our articles are not intended to be financial advice. It does not constitute a recommendation to buy or sell any stock, and does not take account of your objectives, or your financial situation. We aim to bring you long-term focused analysis driven by fundamental data. Note that our analysis may not factor in the latest price-sensitive company announcements or qualitative material. Simply Wall St has no position in any stocks mentioned.