
Hubbell Incorporated's (NYSE:HUBB) high institutional ownership speaks for itself as stock continues to impress, up 5.0% over last week
Key Insights
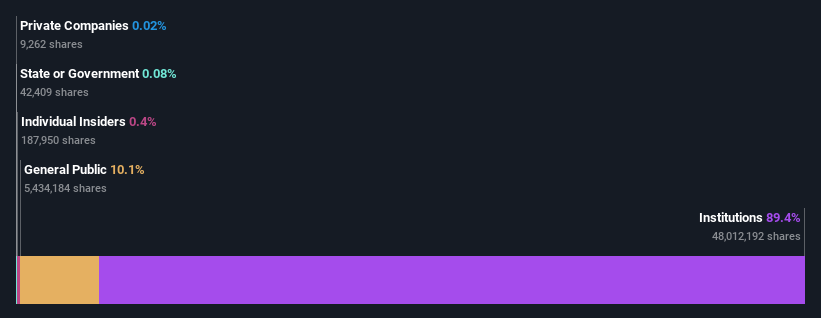
- Institutions' substantial holdings in Hubbell implies that they have significant influence over the company's share price
- The top 13 shareholders own 50% of the company
- Insiders have been buying lately
If you want to know who really controls Hubbell Incorporated (NYSE:HUBB), then you'll have to look at the makeup of its share registry. With 89% stake, institutions possess the maximum shares in the company. Put another way, the group faces the maximum upside potential (or downside risk).
And things are looking up for institutional investors after the company gained US$1.0b in market cap last week. One-year return to shareholders is currently 51% and last week’s gain was the icing on the cake.
Let's take a closer look to see what the different types of shareholders can tell us about Hubbell.
Check out our latest analysis for Hubbell
What Does The Institutional Ownership Tell Us About Hubbell?
Institutional investors commonly compare their own returns to the returns of a commonly followed index. So they generally do consider buying larger companies that are included in the relevant benchmark index.
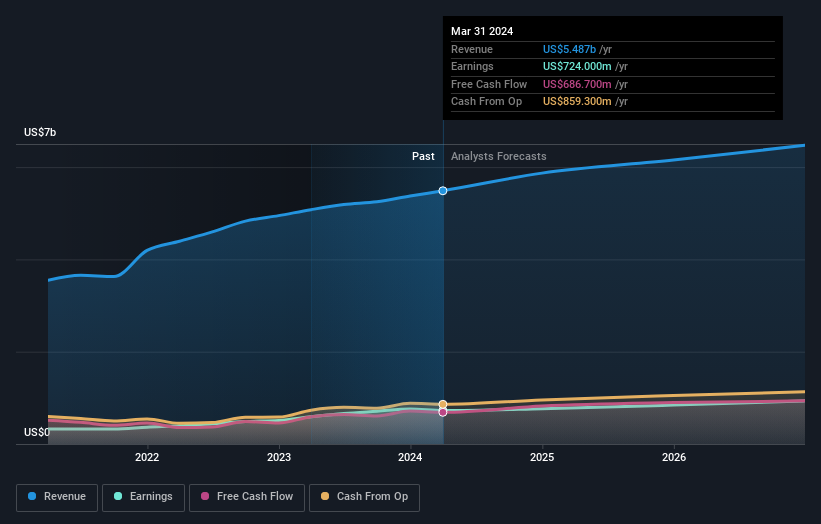
Hubbell already has institutions on the share registry. Indeed, they own a respectable stake in the company. This implies the analysts working for those institutions have looked at the stock and they like it. But just like anyone else, they could be wrong. When multiple institutions own a stock, there's always a risk that they are in a 'crowded trade'. When such a trade goes wrong, multiple parties may compete to sell stock fast. This risk is higher in a company without a history of growth. You can see Hubbell's historic earnings and revenue below, but keep in mind there's always more to the story.
Institutional investors own over 50% of the company, so together than can probably strongly influence board decisions. Hedge funds don't have many shares in Hubbell. Looking at our data, we can see that the largest shareholder is The Vanguard Group, Inc. with 12% of shares outstanding. Meanwhile, the second and third largest shareholders, hold 7.4% and 4.6%, of the shares outstanding, respectively.
A closer look at our ownership figures suggests that the top 13 shareholders have a combined ownership of 50% implying that no single shareholder has a majority.
While it makes sense to study institutional ownership data for a company, it also makes sense to study analyst sentiments to know which way the wind is blowing. There are plenty of analysts covering the stock, so it might be worth seeing what they are forecasting, too.
Insider Ownership Of Hubbell
The definition of company insiders can be subjective and does vary between jurisdictions. Our data reflects individual insiders, capturing board members at the very least. Company management run the business, but the CEO will answer to the board, even if he or she is a member of it.
Insider ownership is positive when it signals leadership are thinking like the true owners of the company. However, high insider ownership can also give immense power to a small group within the company. This can be negative in some circumstances.
Our data suggests that insiders own under 1% of Hubbell Incorporated in their own names. It is a very large company, so it would be surprising to see insiders own a large proportion of the company. Though their holding amounts to less than 1%, we can see that board members collectively own US$77m worth of shares (at current prices). It is good to see board members owning shares, but it might be worth checking if those insiders have been buying.
General Public Ownership
With a 10% ownership, the general public, mostly comprising of individual investors, have some degree of sway over Hubbell. While this size of ownership may not be enough to sway a policy decision in their favour, they can still make a collective impact on company policies.
Next Steps:
I find it very interesting to look at who exactly owns a company. But to truly gain insight, we need to consider other information, too. Take risks for example - Hubbell has 1 warning sign we think you should be aware of.
If you would prefer discover what analysts are predicting in terms of future growth, do not miss this free report on analyst forecasts.
NB: Figures in this article are calculated using data from the last twelve months, which refer to the 12-month period ending on the last date of the month the financial statement is dated. This may not be consistent with full year annual report figures.
Have feedback on this article? Concerned about the content? Get in touch with us directly. Alternatively, email editorial-team (at) simplywallst.com.
This article by Simply Wall St is general in nature. We provide commentary based on historical data and analyst forecasts only using an unbiased methodology and our articles are not intended to be financial advice. It does not constitute a recommendation to buy or sell any stock, and does not take account of your objectives, or your financial situation. We aim to bring you long-term focused analysis driven by fundamental data. Note that our analysis may not factor in the latest price-sensitive company announcements or qualitative material. Simply Wall St has no position in any stocks mentioned.