
3 Asian Stocks Estimated To Be Trading At Discounts Of Up To 49.6%
As Asian markets navigate a landscape marked by fluctuating oil prices and technology sector volatility, investors are increasingly on the lookout for opportunities that may be undervalued in this complex environment. Identifying stocks trading at significant discounts can offer potential value, especially when market sentiment is driven by broader economic uncertainties.
Top 10 Undervalued Stocks Based On Cash Flows In Asia
| Name | Current Price | Fair Value (Est) | Discount (Est) |
| Thai Credit Bank (SET:CREDIT) | THB22.90 | THB45.74 | 49.9% |
| Smartsens Technology (Shanghai) (SHSE:688213) | CN¥108.69 | CN¥215.98 | 49.7% |
| P&H Tech (KOSDAQ:A239890) | ₩3110.00 | ₩6201.38 | 49.8% |
| PAL GROUP Holdings (TSE:2726) | ¥1480.00 | ¥2915.17 | 49.2% |
| Nissei ASB Machine (TSE:6284) | ¥7900.00 | ¥15783.35 | 49.9% |
| Natural Food International Holding (SEHK:1837) | HK$1.41 | HK$2.80 | 49.6% |
| Kissei Pharmaceutical (TSE:4547) | ¥3855.00 | ¥7679.17 | 49.8% |
| Kingnet Network (SZSE:002517) | CN¥15.57 | CN¥30.58 | 49.1% |
| Henan Mingtai Al.IndustrialLtd (SHSE:601677) | CN¥14.11 | CN¥28.12 | 49.8% |
| ENN Energy Holdings (SEHK:2688) | HK$49.38 | HK$97.32 | 49.3% |
Let's uncover some gems from our specialized screener.
Natural Food International Holding (SEHK:1837)
Overview: Natural Food International Holding Limited is an investment holding company that manufactures and sells natural health food products in China, with a market cap of HK$3.09 billion.
Operations: The company generates revenue of CN¥2.84 billion from processing and selling natural health products in China.
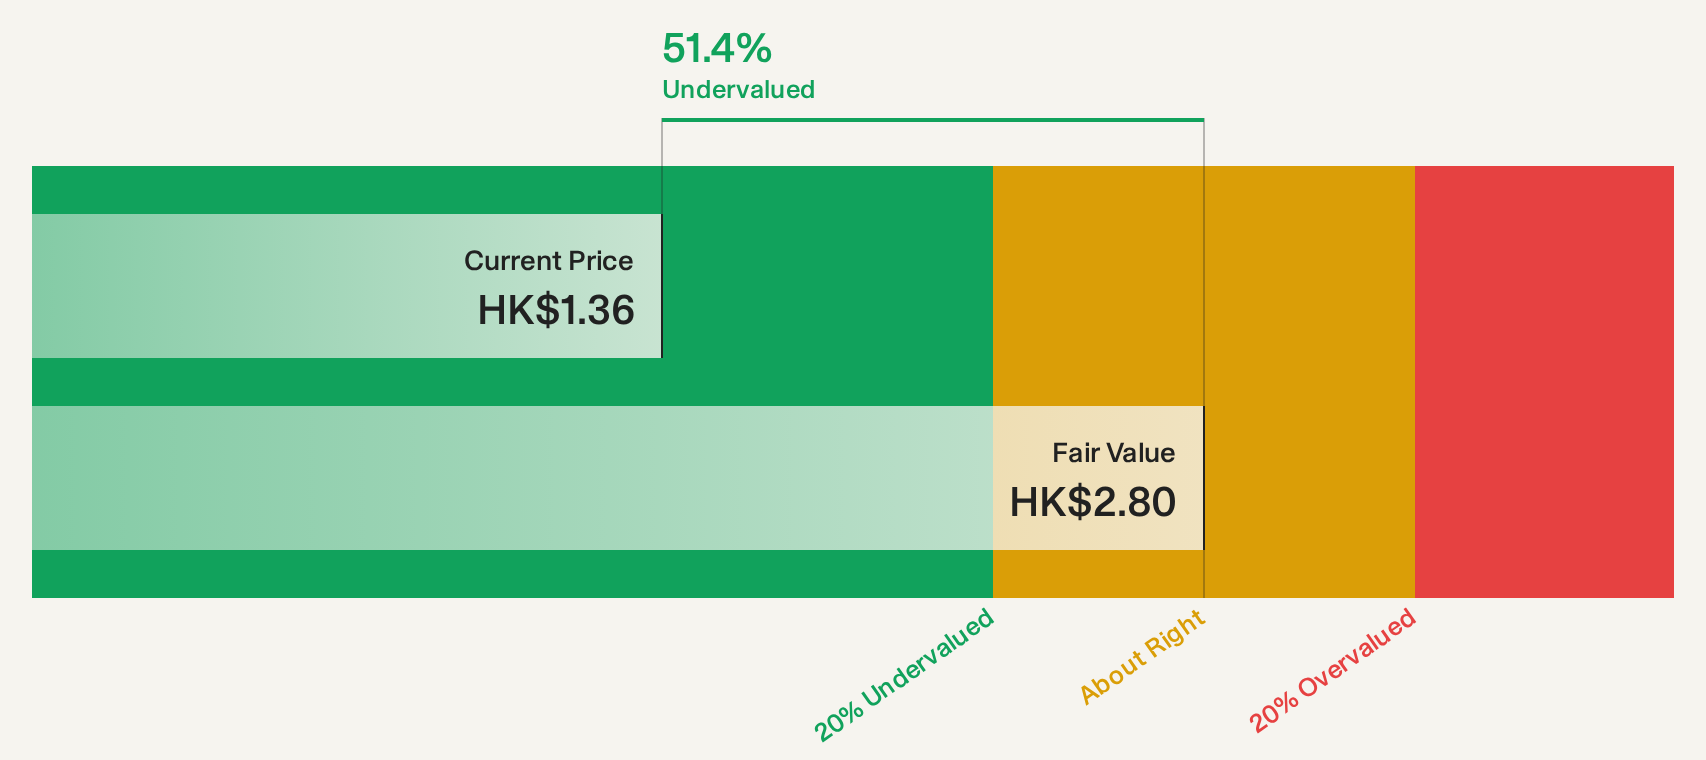
Estimated Discount To Fair Value: 49.6%
Natural Food International Holding is trading at a significant discount to its estimated fair value, with a current price of HK$1.41 compared to an estimated cash flow value of HK$2.8. The company has demonstrated robust earnings growth, reporting CNY 155.9 million in net income for the first half of 2026, up from CNY 106.77 million the previous year. Despite an unstable dividend track record, its forecasted revenue and earnings growth outpace the Hong Kong market averages significantly.
- Insights from our recent growth report point to a promising forecast for Natural Food International Holding's business outlook.
- Click to explore a detailed breakdown of our findings in Natural Food International Holding's balance sheet health report.
Tsubakimoto Chain (TSE:6371)
Overview: Tsubakimoto Chain Co. is a Japanese manufacturer specializing in chains, motion control, mobility, and materials handling products, with a market cap of ¥274.71 billion.
Operations: The company's revenue is primarily derived from its Mobility segment at ¥108.26 billion and Materials Handling Systems at ¥72.13 billion.
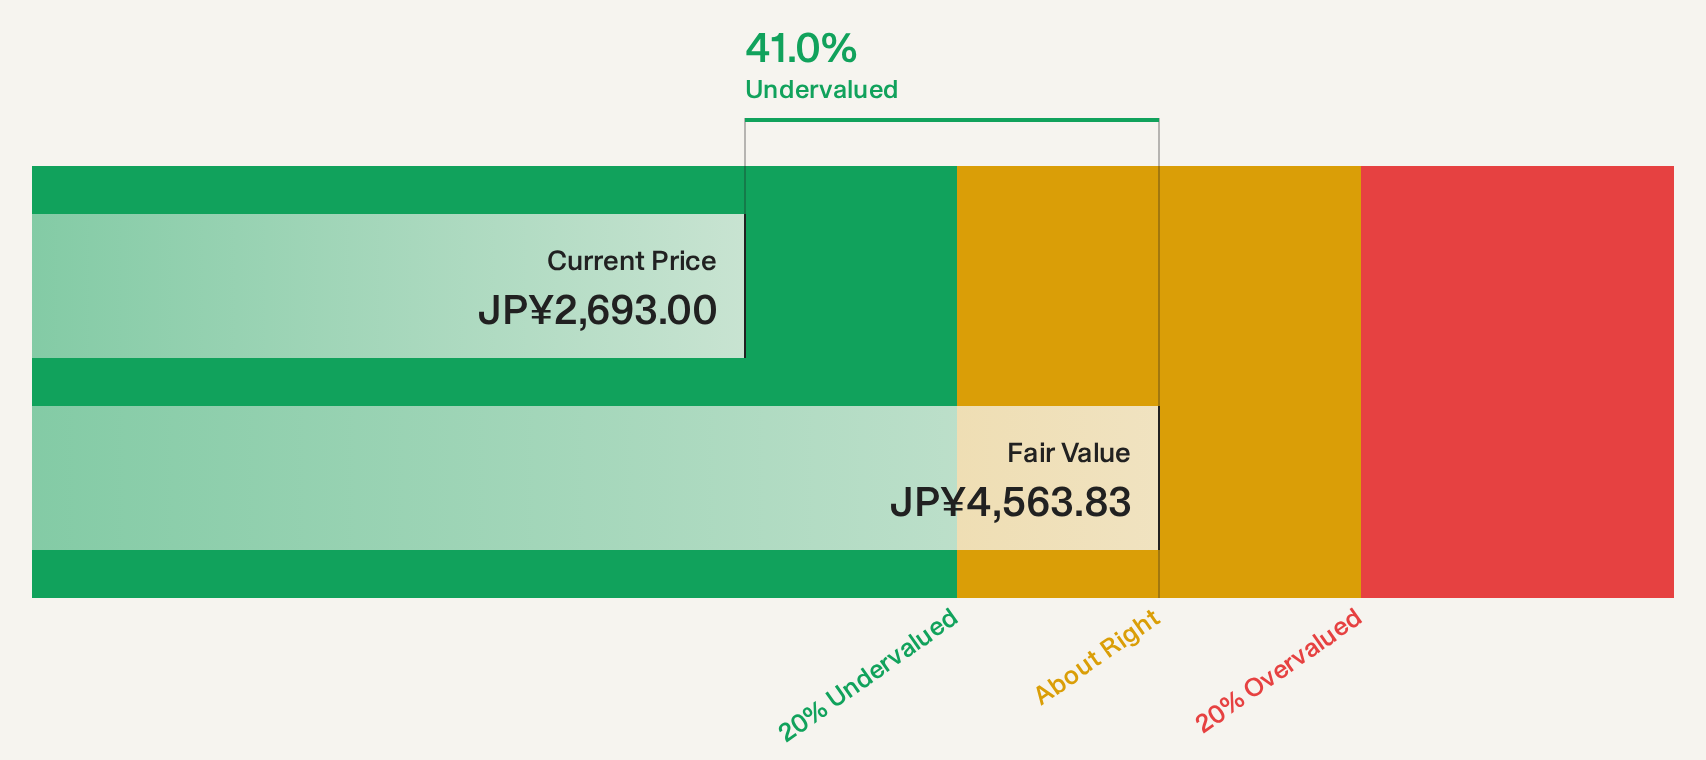
Estimated Discount To Fair Value: 41.1%
Tsubakimoto Chain is trading at ¥2,703, significantly below its estimated future cash flow value of ¥4,586.53. Its recent share buyback program enhanced shareholder value by repurchasing 3.18% of shares for ¥8.57 billion. Although revenue and earnings growth forecasts are modest compared to the Japanese market, the stock offers good relative value and a reliable 2.96% dividend yield, making it attractive for investors focused on cash flow valuation disparities in Asia.
- The analysis detailed in our Tsubakimoto Chain growth report hints at robust future financial performance.
- Take a closer look at Tsubakimoto Chain's balance sheet health here in our report.
Marketech International (TWSE:6196)
Overview: Marketech International Corp. engages in the manufacturing, selling, importing, and trading of integrated circuits, semiconductors, and related equipment and materials across Taiwan, China, the United States, and other international markets with a market cap of NT$131.54 billion.
Operations: The company's revenue is primarily derived from three segments: Customized Equipment Manufacturing (NT$10.19 billion), Equipment Materials Agent Sales Business (NT$12.39 billion), and Factory System and Electromechanical System Service Business (NT$41.70 billion).
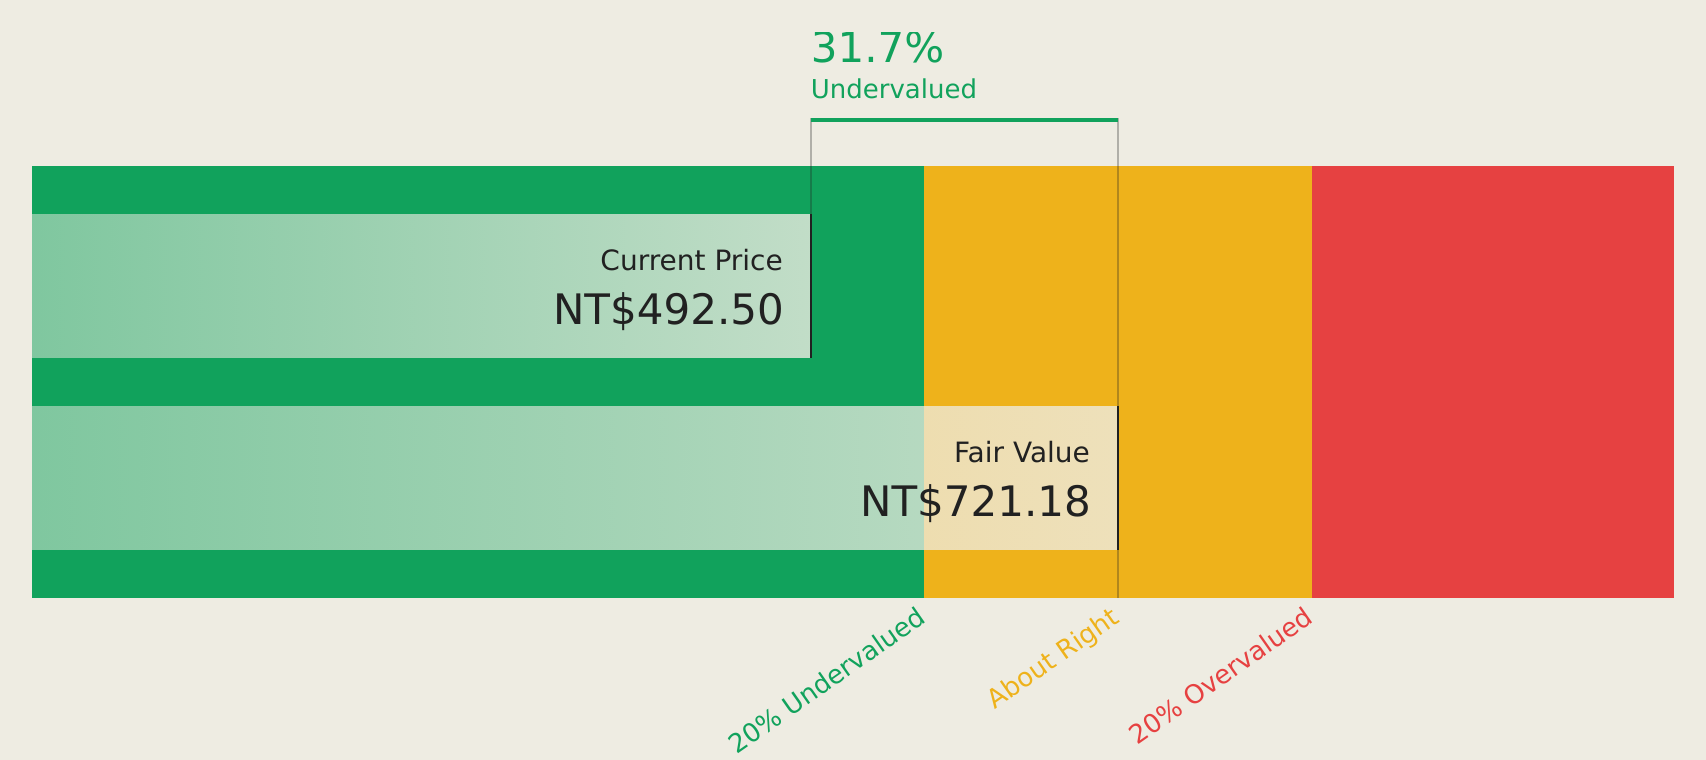
Estimated Discount To Fair Value: 21%
Marketech International is trading at NT$597, below its estimated future cash flow value of NT$755.85, indicating it is undervalued by more than 20%. Recent earnings reports show significant growth with second-quarter sales reaching TWD 21.20 billion and net income at TWD 1.80 billion, compared to TWD 12.20 billion and TWD 396.39 million a year ago respectively, highlighting robust financial performance supporting its undervaluation based on discounted cash flows in Asia.
- Upon reviewing our latest growth report, Marketech International's projected financial performance appears quite optimistic.
- Unlock comprehensive insights into our analysis of Marketech International stock in this financial health report.
Seize The Opportunity
- Discover the full array of 184 Undervalued Asian Stocks Based On Cash Flows right here.
- Are any of these part of your asset mix? Tap into the analytical power of Simply Wall St's portfolio to get a 360-degree view on how they're shaping up.
- Elevate your portfolio with Simply Wall St, the ultimate app for investors seeking global market coverage.
Curious About Other Options?
- Explore high-performing small cap companies that haven't yet garnered significant analyst attention.
- Diversify your portfolio with solid dividend payers offering reliable income streams to weather potential market turbulence.
- Fuel your portfolio with companies showing strong growth potential, backed by optimistic outlooks both from analysts and management.
This article by Simply Wall St is general in nature. We provide commentary based on historical data and analyst forecasts only using an unbiased methodology and our articles are not intended to be financial advice. It does not constitute a recommendation to buy or sell any stock, and does not take account of your objectives, or your financial situation. We aim to bring you long-term focused analysis driven by fundamental data. Note that our analysis may not factor in the latest price-sensitive company announcements or qualitative material. Simply Wall St has no position in any stocks mentioned.
Have feedback on this article? Concerned about the content? Get in touch with us directly. Alternatively, email editorial-team@simplywallst.com