
How September Traffic Trends Will Impact DFDS (CPSE:DFDS) Investors
- DFDS A/S reported operating data for September 2026 that showed freight at 3,488,000 lane metres and 403,000 passengers, both slightly below the prior year month, while twelve month freight volumes edged to 41,764,000 lane metres and passenger traffic reached 4,904,000.
- The contrast between broadly steady freight volumes and weaker passenger numbers highlights how DFDS’s earnings mix increasingly leans on freight corridors, rather than leisure travel.
- We will now examine how DFDS’s investment narrative could be affected by the softer passenger trend in its latest operating update.
Scan the Baltic freight theme playing out at DFDS and then size up other transport stocks with similar momentum using our hand picked list of solid balance sheet and fundamentals (207 results).
DFDS Investment Narrative Recap
To own DFDS, you need to be comfortable with a freight led story where corridor volumes and logistics execution matter more than tourist traffic. The latest update fits that picture. Freight lane metres over the last twelve months are broadly flat at 41,764,000, so the core network is holding its ground while management works on operational fixes elsewhere.
The short term swing factor is whether the freight and logistics businesses can offset weaker passenger demand. Twelve month passenger volumes of 4,904,000 are well below the prior 5,477,000. The key risk is that softer ticket and onboard spend mix with ongoing Mediterranean and TES logistics restructuring, which could keep group profitability under pressure.
Among current developments, the group wide strategy review that DFDS launched in August 2026 looks most relevant to these operating numbers. A review that defines where DFDS competes, how it differentiates routes, and how it allocates capital across ferries and logistics is central when freight is steady but holiday traffic is softer.
For you as an investor, that review interacts directly with catalysts such as the Mediterranean corridor changes and the TES turnaround plan. Management choices on fleet renewal, corridor footprint and technology could influence how much value DFDS ultimately extracts from largely stable freight volumes while working through weaker passenger trends and restructuring risks in underperforming units.
What The DFDS Analyst Framework Assumes
DFDS' story in analyst models leans heavily on a gradual rebuild in profitability over the next few years, rather than a step change in passenger demand. Consensus assumptions point to revenue expanding by 2.9% a year. This implies a measured pickup in activity across the freight and logistics network, rather than a volume surge. Against that backdrop, margins are expected to move from a slight loss position today, with profit margins at around 0.1% in the red, to a 4.2% profit margin in roughly three years.
The earnings bridge is even more striking. Forecast consensus points to DKK 1.4b of earnings by 2029, compared with an earnings loss of DKK 21.0m today. That is a swing of about DKK 1.4b in absolute profit terms. Analysts are effectively assuming that DFDS turns recent restructuring areas and weaker passenger exposure into a much cleaner income statement. The same models also build in a small increase in the share count, with the number of shares expected to grow by about 0.19% a year. This slightly dilutes that earnings growth on a per share basis.
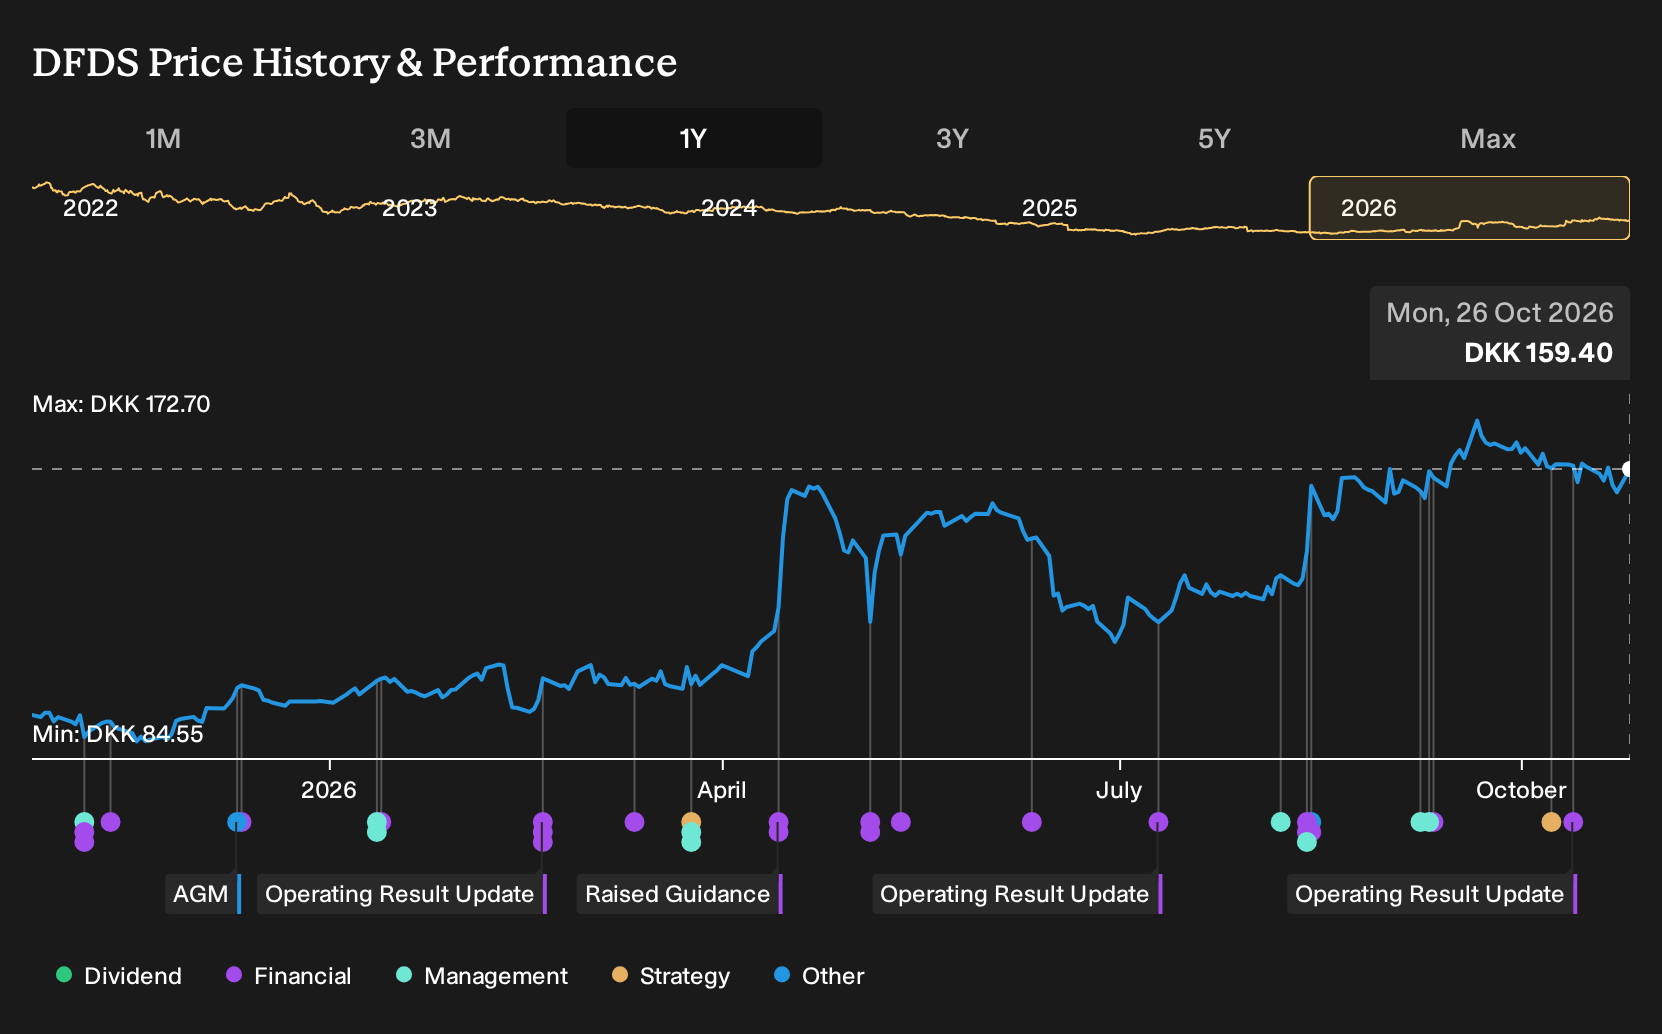
Valuation inputs sit on top of those operating expectations. By 2029, consensus points to revenue of DKK 34.4b and earnings of DKK 1.4b, with the stock trading on a P/E multiple of 7.9x if those numbers are met. That prospective multiple is below the quoted 14.4x for the wider GB shipping peer group. The current DFDS share price of DKK 155 and the average analyst target of DKK 163.5, a 5.2% gap, therefore suggest that a fair amount of this recovery framework is already embedded in the market view.
DFDS' narrative projects DKK 34.4b revenue and DKK 1.4b earnings by 2029. This requires 2.9% yearly revenue growth and an earnings increase of about DKK 1.4b from current earnings of a DKK 21.0m loss.
Uncover how DFDS' fair value indicates a 3% potential upside to its current price before the market closes the discount.
Exploring Other Perspectives
One alternate angle on DFDS focuses less on freight resilience and more on the risk that weak passenger routes cap long term earnings. The most bearish analysts were only pencilling in DKK 34.2b of revenue and DKK 1.1b of profit by 2029 before this update. Use those lower figures as a reference point and explore how fresh operating data might shift that story.
Explore 2 other DFDS fair value estimates, including one that indicates up to 14% downside from the current price.
Reach Your Own Conclusion
Don't just follow the ticker. Dig into the data and build a conviction that's truly your own.
- A great starting point for your DFDS research is our analysis highlighting 3 key rewards and 2 important warning signs that could impact your investment decision.
- See our latest analysis for DFDS. The report includes a comprehensive fundamental analysis summarized in a single visual, the Snowflake, making it easy to evaluate DFDS' overall financial health at a glance.
Looking for more investment ideas beyond DFDS?
Once you have a view on DFDS, it can help to zoom out and compare it with other opportunities that share similar qualities, whether you care most about value, resilience, or income.
- If you want potential mispricing with quality fundamentals in the mix, start with our carefully filtered list of 195 high quality undervalued stocks that pass a tough fundamental screen.
- For investors who care more about balance sheet strength and durability through different cycles, work through this curated list of solid balance sheet and fundamentals (207 results) to see which businesses line up with your risk comfort.
- If income is your focus and you prefer companies that already offer meaningful cash returns to shareholders, scan this focused set of 224 dividend fortresses that clear a 5% yield hurdle.
Have feedback on this article? Concerned about the content? Get in touch with us directly. Alternatively, email editorial-team@simplywallst.com