
Is Tokyo Steel Manufacturing (TSE:5423) Fully Valued Following Mixed Earnings And Raised Guidance?
Tokyo Steel Manufacturing earnings trigger a closer look
Tokyo Steel Manufacturing (TSE:5423) just posted half year results that paired higher sales with weaker profitability, while also lifting full year profit guidance on asset sales and product price revisions.
Tokyo Steel Manufacturing’s share price has climbed 15.4% year to date, with a 3.5% one day share price return following the guidance upgrade. A 26.3% one year total shareholder return points to investors rewarding the mix of higher sales and asset driven profit support despite recent margin pressure.
Scan how Tokyo Steel Manufacturing compares to other metal producers that combine pricing power with balance sheet strength by reviewing our curated list of list of solid balance sheet and fundamentals (23 results)
After a sharp move on refreshed guidance and with Tokyo Steel Manufacturing trading close to analyst target and intrinsic value estimates, the tension is simple: Do you pay up now for asset-supported profits, or wait for cleaner earnings power to show through?
Price-to-earnings of 18.4x: Is it justified for Tokyo Steel Manufacturing?
Valuation has shifted for Tokyo Steel Manufacturing, with the shares at ¥1,707 trading on a richer P/E multiple than both peers and its own indicated fair level.
The P/E ratio compares what investors pay per share with the earnings that each share generates. For a steel producer like Tokyo Steel Manufacturing, this measure often reflects how confident the market is about future profitability and where earnings sit in the cycle. A higher P/E usually signals that shareholders are paying more for each unit of current profit.
Here, the stock changes hands at a P/E of 18.4x. That is significantly above the JP Metals and Mining industry average of 10.4x and also above the peer average of 11.8x. The estimated fair P/E ratio sits at 11.1x, so the current valuation carries a clear premium that the market could eventually re-rate toward if earnings or sentiment soften.
Explore the SWS fair ratio for Tokyo Steel Manufacturing.
Result: Price-to-earnings of 18.4x (OVERVALUED)
Still, the risk is that asset sales and one off gains mask weaker underlying earnings, while any shift in steel pricing could quickly challenge this premium.
Find out about the key risks to this Tokyo Steel Manufacturing narrative.
Another view on Tokyo Steel Manufacturing’s value
The P/E tells one story. The SWS DCF model tells a very different one. On that cash flow view, Tokyo Steel Manufacturing at ¥1,707 trades well above an estimated future cash flow value of ¥459.46, which points to an overvalued reading. Which lens do you trust when the signals clash?
Look into how the SWS DCF model arrives at its fair value.
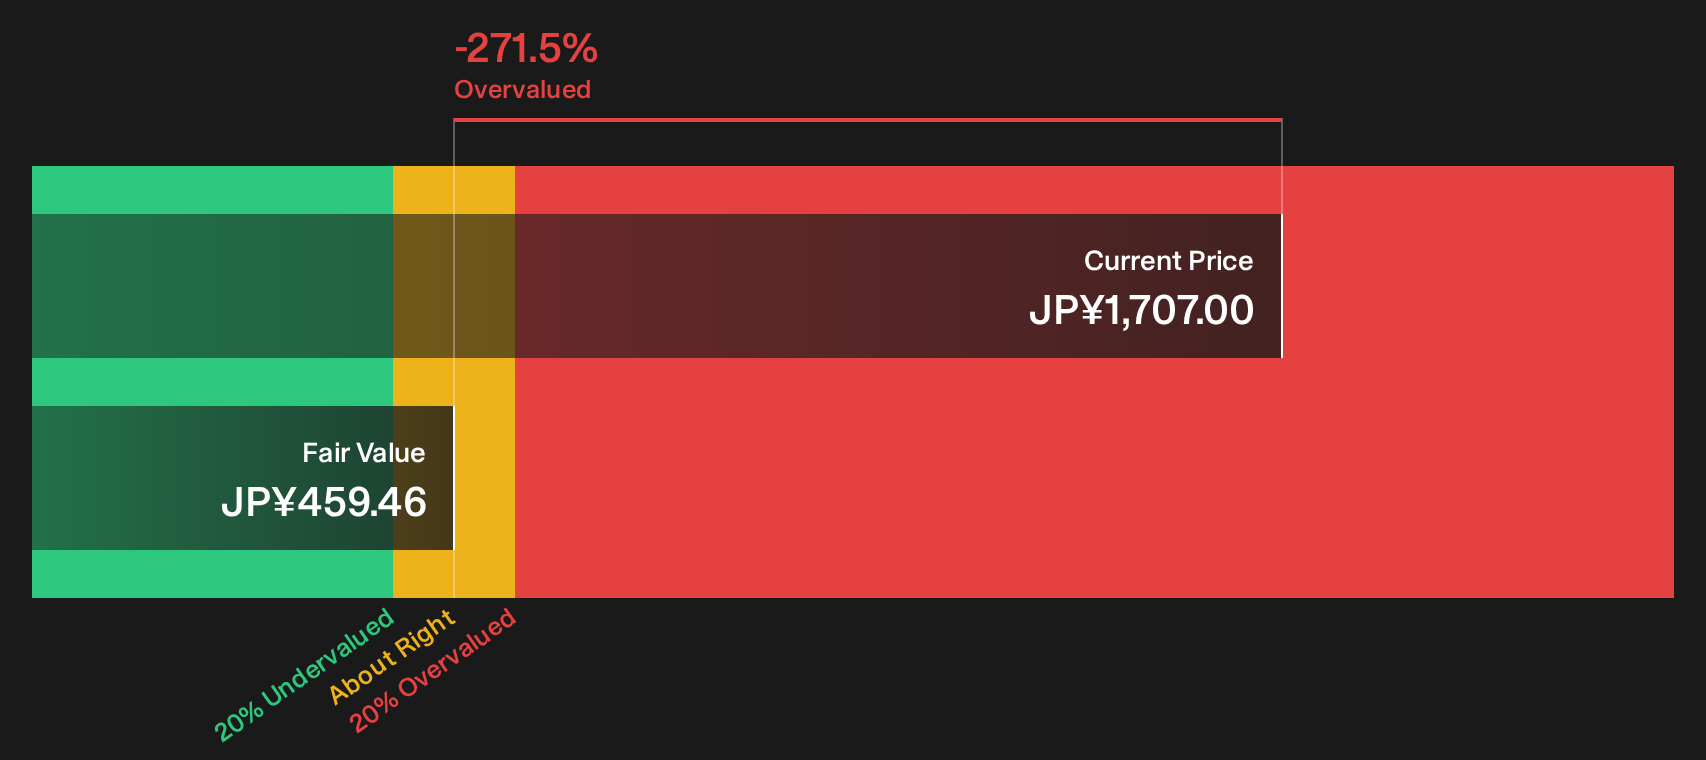
Simply Wall St performs a discounted cash flow (DCF) on every stock in the world every day (check out Tokyo Steel Manufacturing for example). We show the entire calculation in full. You can track the result in your watchlist or portfolio and be alerted when this changes, or use our stock screener to discover 16 high quality undervalued stocks. If you save a screener we even alert you when new companies match - so you never miss a potential opportunity.
Next Steps
If this all feels finely balanced, that is exactly why it pays to move early, review the underlying risk data and weigh the 4 important warning signs
Looking for more investment ideas beyond Tokyo Steel Manufacturing?
Do not stop at Tokyo Steel Manufacturing. Use this momentum to scan the market, compare opportunities, and build a watchlist that reflects how you want to invest.
- Spot potential value opportunities early by tracking companies on our 16 high quality undervalued stocks that pair solid fundamentals with pricing that may still be catching up.
- Strengthen your income stream by reviewing the 29 dividend fortresses that focus on higher yields backed by more robust financial profiles.
- Dial down portfolio stress by checking the 22 resilient stocks with low risk scores that score well on resilience and financial health before the crowd piles in.
Have feedback on this article? Concerned about the content? Get in touch with us directly. Alternatively, email editorial-team@simplywallst.com