
Rakus (TSE:3923) Just Gave Investors Something To Think About
Rakus trading update and what September’s sales figure means for investors
Rakus (TSE:3923) reported preliminary consolidated sales of ¥4,928 million for September 2026, giving investors fresh monthly data to assess the cloud services provider’s recent business activity and reset expectations around the stock.
Rakus shares trade at ¥1,117.5 after a 1-month share price return of 6.68% and a year to date share price gain of 7.30%. However, the 1-year total shareholder return has declined 14.39%, hinting that recent momentum is improving while longer term holders are still under water.
Scan Rakus alongside hand-picked cloud and software peers by running the 72 high quality undiscovered gems that focuses on under-the-radar businesses with solid fundamentals.
Bulls point to steady annual revenue and profit growth at Rakus and a recent share price rebound. Bears focus on a weaker 1 year return and a past 5 year share price decline. Which side do current valuation metrics support?
Preferred P/E of 16.2x: Is it justified for Rakus?
On simple valuation terms, Rakus looks modestly cheap, with the shares at ¥1,117.5 implying a P/E of 16.2x that screens lower than both peers and the wider Japanese software industry.
The P/E ratio compares what you pay per share to the earnings that each share generates. For a software-focused group like Rakus, this measure gives you a quick sense of how the market is weighing current profitability relative to the rest of the sector, where investors often pay up for recurring revenue and capital-light operations.
Rakus trades on a P/E of 16.2x against an estimated fair P/E of 21.8x, so the current tag sits well below the level our modelling suggests the market could move towards. That discount is even starker when set against the JP Software industry average of 18.4x and a peer group sitting around 39.9x, which points to the market pricing in more caution around this ticker than the earnings record and forecast growth alone might indicate.
Explore the SWS fair ratio for Rakus.
Result: Price-to-earnings of 16.2x (UNDERVALUED)
Still, Rakus carries clear risks, including a 1 year shareholder return that declined 14.39% and a 5 year total return that fell 37.94%.
Find out about the key risks to this Rakus narrative.
Another view on Rakus: our DCF model
P/E suggests Rakus looks inexpensive, and our DCF model also points in the same direction, with the shares at ¥1,117.5 trading about 11.2% below an estimated fair value of ¥1,258.66. That combination can appear attractive, but it also raises a question: what if the cash flow assumptions prove too optimistic or too cautious?
Look into how the SWS DCF model arrives at its fair value.
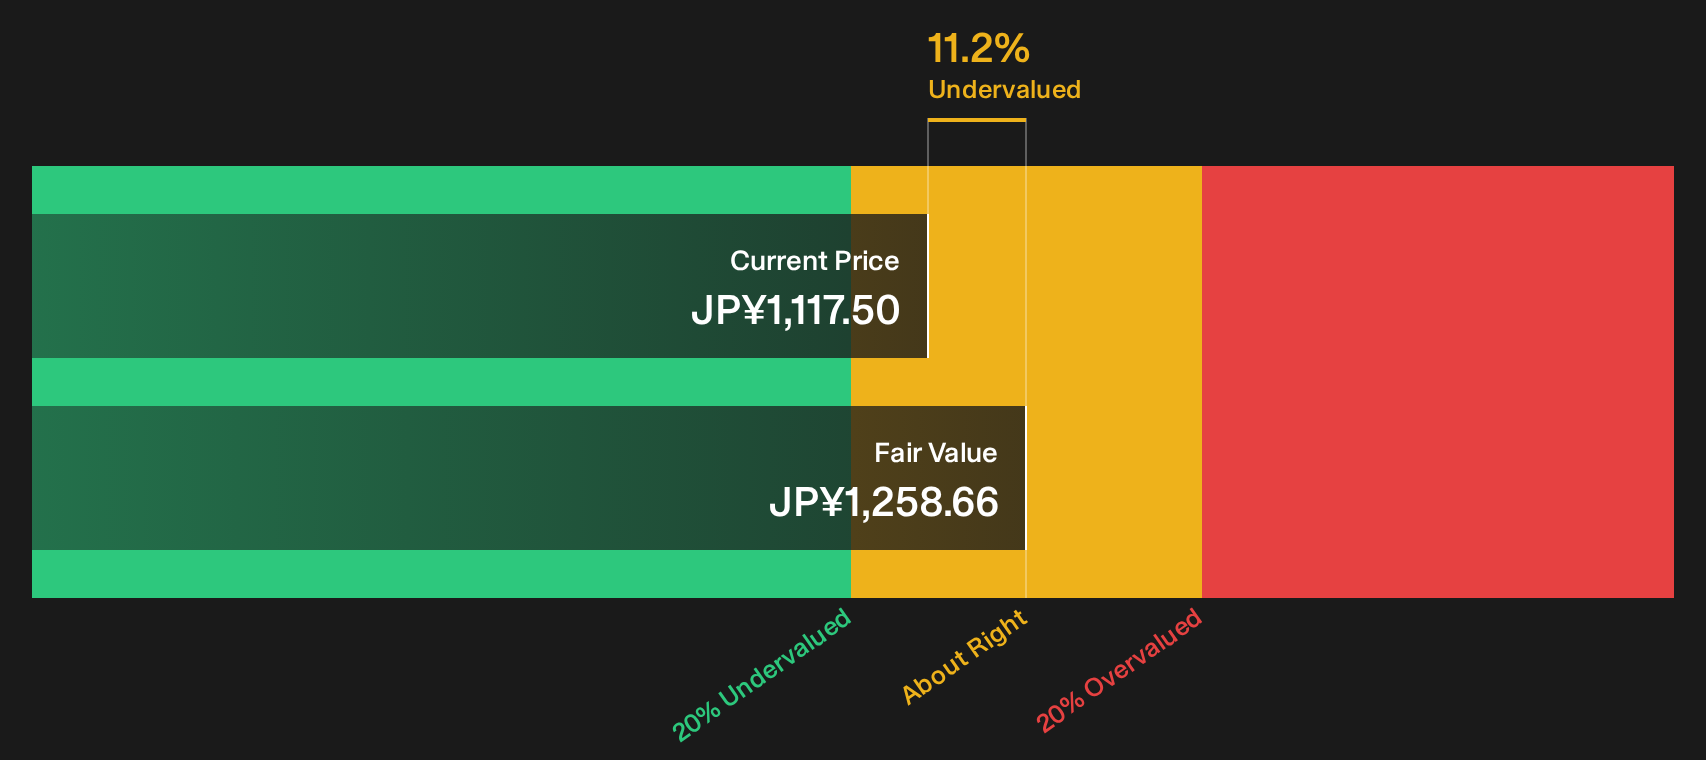
Simply Wall St performs a discounted cash flow (DCF) on every stock in the world every day (check out Rakus for example). We show the entire calculation in full. You can track the result in your watchlist or portfolio and be alerted when this changes, or use our stock screener to discover 14 high quality undervalued stocks. If you save a screener we even alert you when new companies match - so you never miss a potential opportunity.
Next Steps
Mixed signals around Rakus can either unsettle you or encourage you to investigate the story behind the numbers. To see both sides clearly, review the 4 key rewards and 2 important warning signs
Looking for more Rakus investment ideas?
Before moving on, give yourself options beyond Rakus by scanning other focused stock ideas on Simply Wall St's screener so you are not relying on a single story.
- Spot potential value opportunities early by working through the 14 high quality undervalued stocks that filters for financially strong companies trading below their estimated worth.
- Build a sturdier core for your portfolio by using the list of solid balance sheet and fundamentals (23 results) to concentrate on businesses with healthier debt and cash positions.
- Dial down portfolio stress by checking the 22 resilient stocks with low risk scores and concentrating on stocks with lower overall risk scores.
Have feedback on this article? Concerned about the content? Get in touch with us directly. Alternatively, email editorial-team@simplywallst.com