
Cui Dongshu: From January to September 2026, 290,000 cars were imported, down 20% year-on-year
The Zhitong Finance App learned that in September 2026, 21,000 imported cars were imported, down 49% from the previous year and 6% from the previous month, an astonishing decline of 21,000 vehicles. From January to September 2026, 290,000 vehicles were imported, a year-on-year decrease of 20%. Passenger cars account for over 99% of the automobile import structure this year. If pickups in light trucks are included, the number of passenger cars is even higher. The performance of imported hybrid vehicles increased by 15% from January to September 2026. The performance of pure electric passenger cars decreased by 27%, plug-in hybrid cars decreased by 54%, and the performance of imported new energy passenger vehicles was weak. The displacement of imported models of passenger cars is concentrated on gasoline models below 2 liters. Last year, 3-4 liters had a better ability to withstand falling, and 1.5-2 liters was relatively good this year.
The downward pressure on imported cars in September was still strong. The top 10 countries with the highest imports in September 2026 were: Japan with 7399 vehicles, Germany with 7255 vehicles, the United Kingdom with 1,488 vehicles, Slovakia with 818 vehicles, Mexico with 791 vehicles, Austria with 355 vehicles, Belgium 112, South Korea with 90 vehicles, and Italy with 90 vehicles. Among them, the top five that increased in growth over the same period were: Mexico 307, Austria 107, Belgium 42, South Korea, and 16 France. The top 10 countries with the highest imports from January to September 2026 are: Japan with 136,652 vehicles, Germany with 66,438 vehicles, 28,350 US vehicles, Slovakia 20,422 vehicles, UK 18803, Mexico 4974, Austria 4193, Thailand 2,270, Italy 786, and South Korea with 760 vehicles. Among them, the top five that increased over the same period were: Thailand 2027, Austria, 1948, Mexico 1,576, China 540, and South Africa 373.
In January-September of this year, the retail sales of 280,000 units of imported cars were poor, with a 32% drop. The performance of falling 39% to 29,000 vehicles in September was very poor, and the pressure is still high. Demand in the domestic and imported luxury car markets is generally weak. Among them, the luxury car market in traditional affluent regions such as Beijing, Shanghai, Hangzhou, Chengdu, and Shenzhen is under high pressure. This year, petroleum producing regions in northern and central western China, such as Xinjiang and Shandong, are strong.
I. Overall trend of China's automobile imports
1. Characteristics of the growth rate of automobile imports
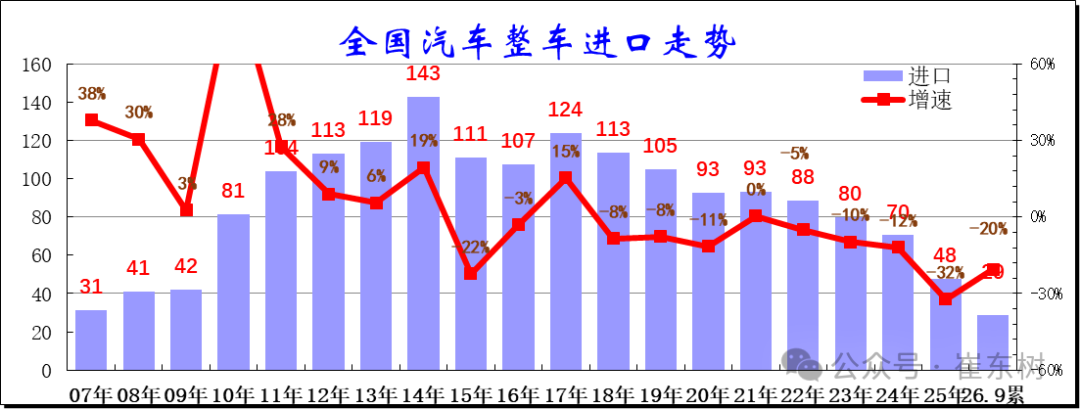
After reaching a peak of 1.43 million imported cars in 2014, the import growth rate improved slightly steadily in 2016-2017, and continued to decline since 2018. The import scale continued to decline sharply in 2024. The annual imports were only 700,000 vehicles, down 12% from the previous year. However, in 2025, the number of imported cars was 480,000, a decrease of 32% over the previous year, and the pressure on imported cars to continue to shrink is strong. From January to September 2026, 290,000 vehicles were imported, a year-on-year decrease of 20%. Under a low base, the decline in imported car imports in 2026 is still quite drastic.
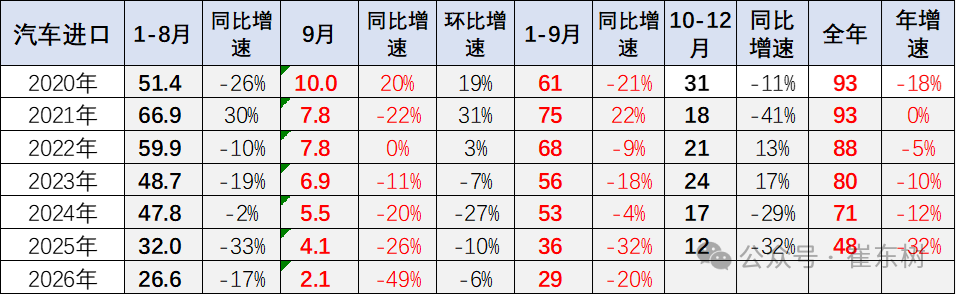
In September 2026, 21,000 imported cars were imported, down 49% year on year and 6% month on month. The decline was astonishing. From January to September 2026, 290,000 vehicles were imported, a year-on-year decrease of 20%. The beginning of 2026 was still a rare improvement in January-September, mainly due to the low base at the end of 2025. However, due to the low base in January 2025, although transportation was blocked due to the war between the US and Iran, the overall decline in imported cars in 2026 was small. With the rise of domestic cars and the acceleration of localization of international brands, automobile imports have continued to be sluggish in recent years. Imported cars have continued to grow negatively for 3 years. If the fluctuations are ironed out, this is 8 consecutive years of negative growth.
2. Monthly trend of vehicle imports
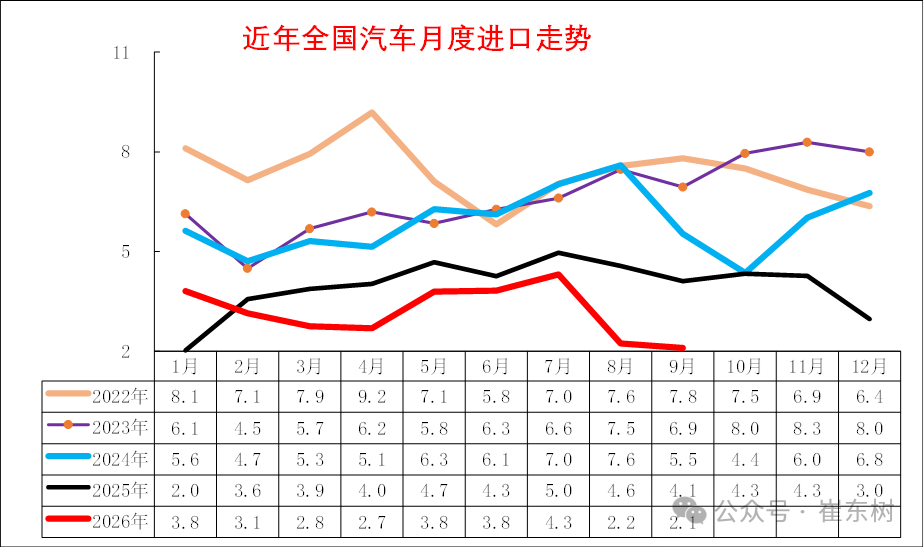
The decline in imports at the beginning of 2025 was astonishing. As trade between China and the US can be expected, imported cars gradually picked up in 2025 and hit a new high in July. However, with the rise of independent high-end cars, imported cars continued to be sluggish in August/November, and the abnormal decline fell back in December 2025, driving growth in January 2026.
The sharp drop in imports from August to September 2026 was due to a sharp decline in Japanese imports. The fuel vehicle market has returned to a dull, steady downward trend.
3. Structural characteristics of automobile imports
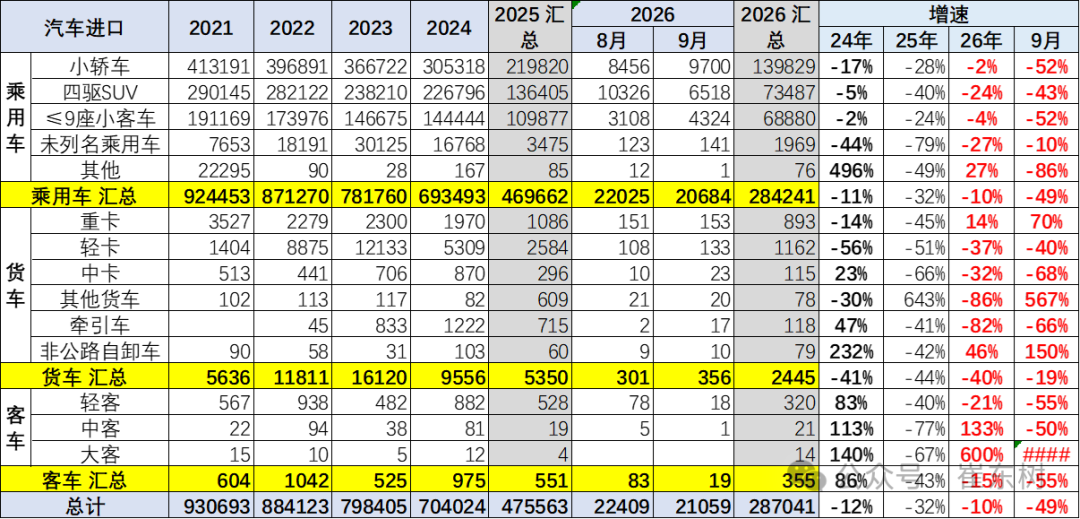
Since 2019, all types of imported models have declined across the board. Passenger car imports were less than demand in September 2026, and inventories declined. Traditional trucks are currently falling back rapidly and markedly.
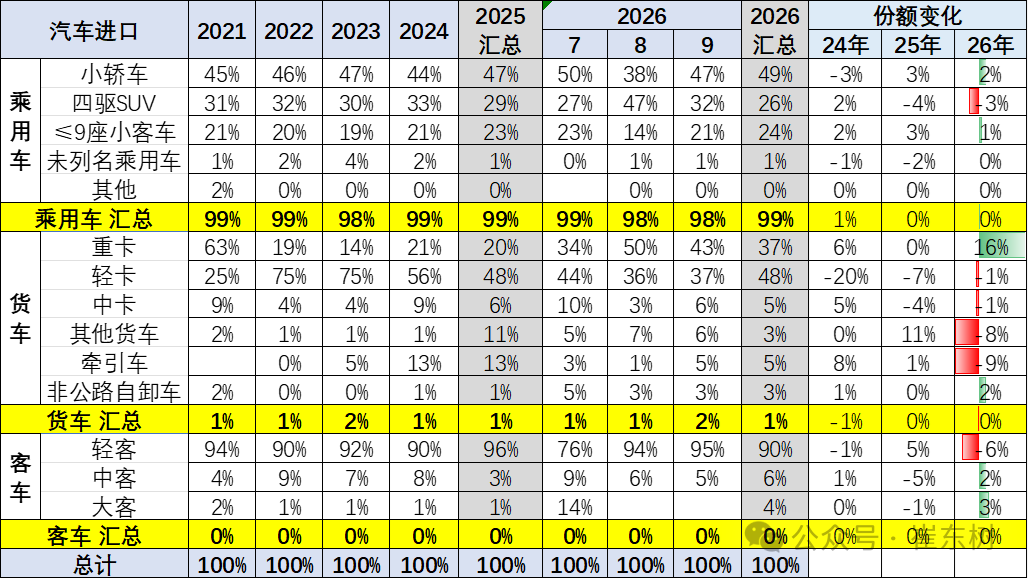
Passenger cars account for over 99% of the automobile import structure this year. If pickups in light trucks are included, the number of passenger cars is even higher.
Imported cars accounted for 49% of passenger cars from January to September 2026, but imports accounted for 47% of imports in September; 24% of imported passenger cars performed well; imported four-wheel drive SUVs accounted for 26% of imports this year, which rebounded to 32% of passenger car imports in September; and unlisted motor vehicles accounted for 1% of imports. Commercial vehicle import performance in 2026 was average. In particular, light truck imports did not decline much, and recently imported pickup trucks were also weak.
4. Characteristics of the import structure of new energy vehicles
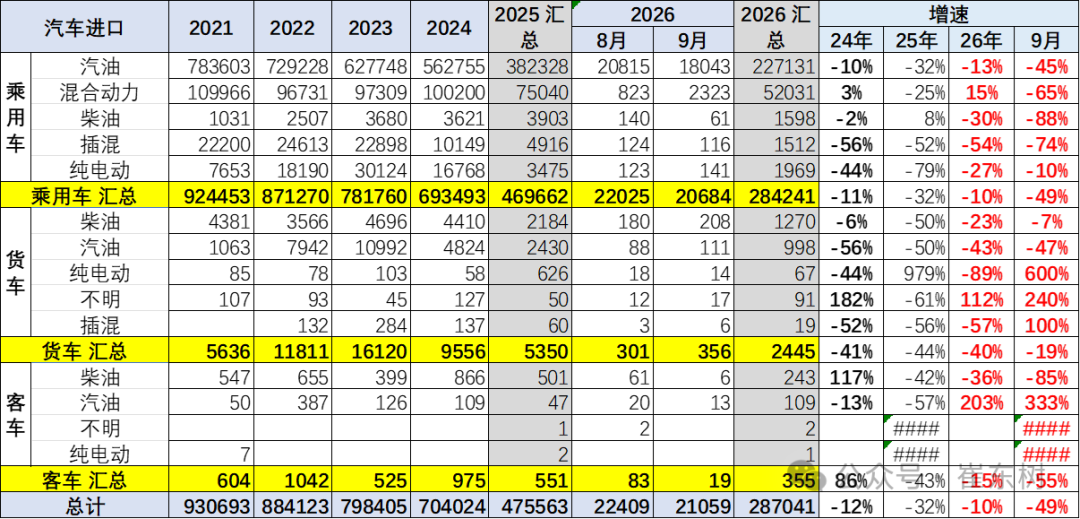
Imported new energy passenger vehicles achieved continued high growth in 2021-2023, and there was a sharp decline in 2025. The performance of imported hybrid vehicles increased by 15% from January to September 2026. The performance of pure electric passenger cars decreased by 27%, plug-in hybrid cars decreased by 54%, and the performance of imported new energy passenger vehicles was weak.
The traditional fuel imported car market for passenger cars has rebounded significantly, and the share of hybrid vehicles has rebounded. However, the decline in the share of gasoline trucks is related to the demand for tractors.
The import performance of high-end gasoline pickups in 2026 was poor. Recently, the domestic NEV pickup market has performed relatively well, but the imported pure electric pickup truck market has performed relatively poorly.
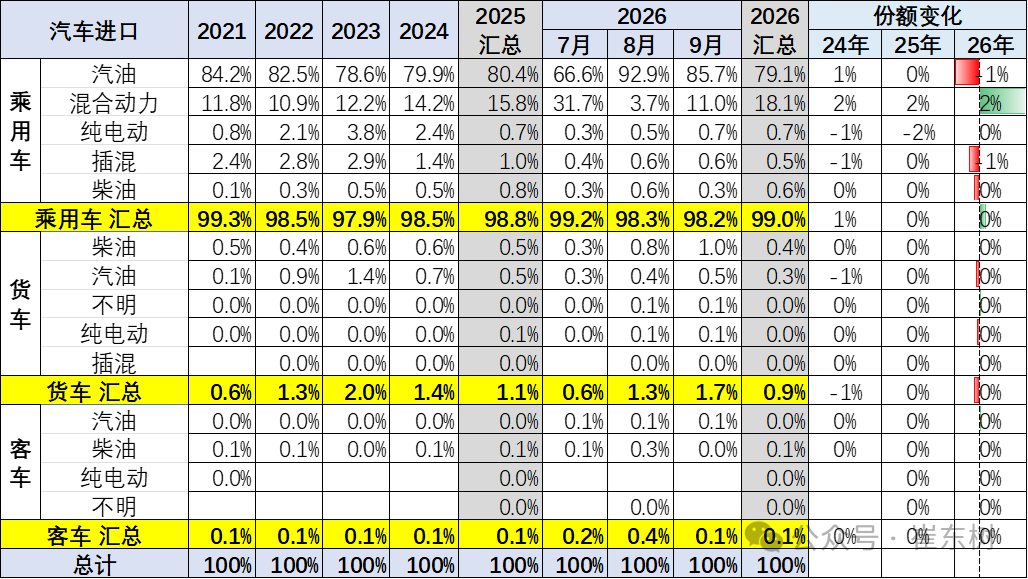
In 2024, imported passenger cars accounted for 3% of new energy imports. From January to September 2026, the share of imported new energy vehicles fell to 1.2%. Pure electric vehicles dropped sharply from last year, and fuel-fuel passenger cars are still the absolute main force. The proportion of gasoline vehicles among trucks is still high, and the decline in pure electric trucks is huge.
5. Structural characteristics of passenger vehicle import emissions
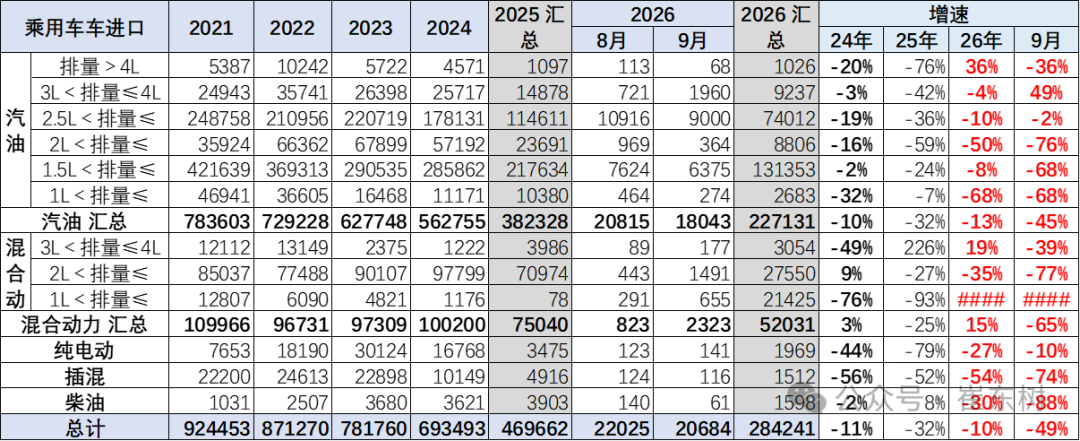
The displacement of imported models of passenger cars is concentrated on gasoline models below 2 liters. Last year, 3-4 liters had a better ability to withstand falling, and 1.5-2 liters was relatively good this year.
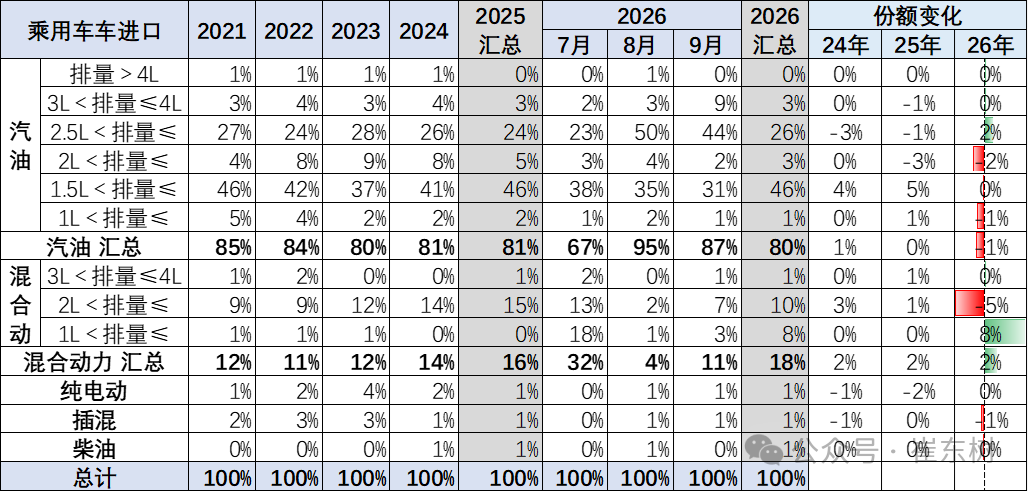
The displacement of imported models of passenger cars is concentrated on gasoline models below 2 liters. From January to September 2026, they accounted for more than half of the total import volume of imported cars, which is basically the same as last year.
There is a clear trend of moving imported hybrid models from 2.5 to 1.5 liters.
II. The pattern of the automobile import market
1. Import characteristics by country
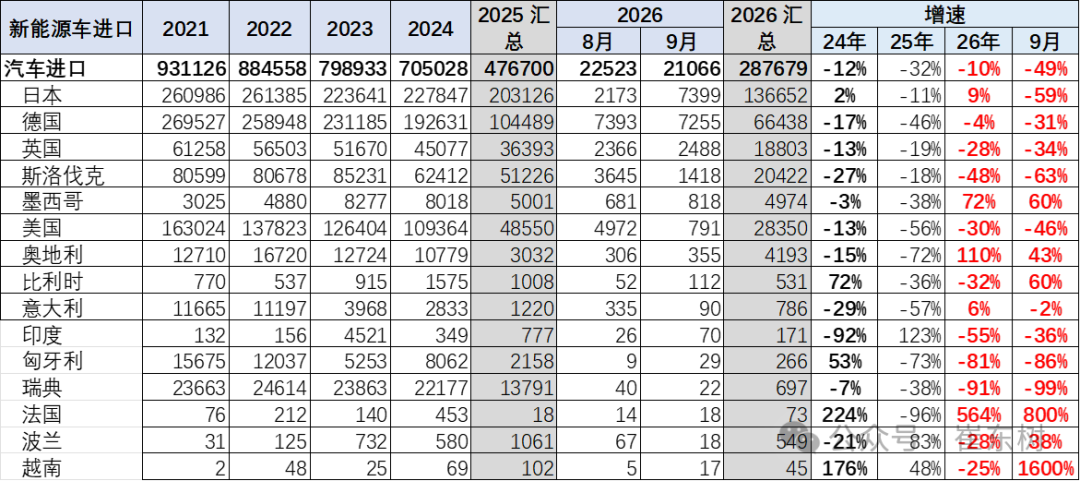
China's passenger car importers are still centered around Germany, Japan, the United Kingdom, Slovakia, and the United States. Recently, Japan's import performance has changed dramatically, and Japanese car imports lost a lot in August.
2. Monthly trend of vehicle imports
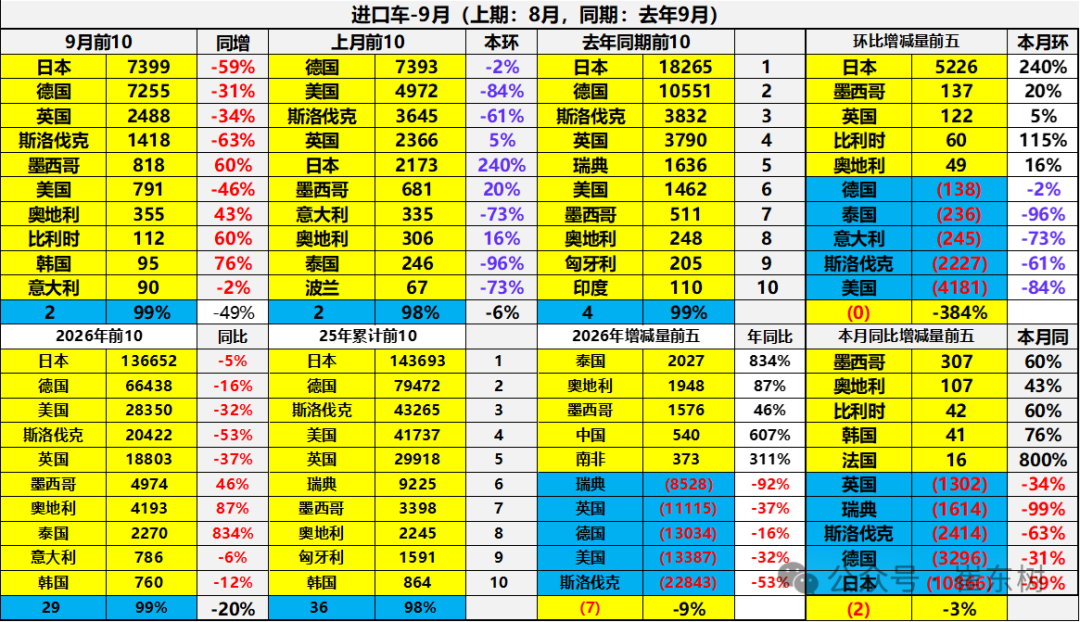
The downward pressure on imported cars in September was still strong. The top 10 countries with the highest imports in September 2026 were: Japan with 7399 vehicles, Germany with 7255 vehicles, the United Kingdom with 1,488 vehicles, Slovakia with 818 vehicles, Mexico with 791 vehicles, Austria with 355 vehicles, Belgium 112, South Korea with 90 vehicles, and Italy with 90 vehicles. Among them, the top five that increased in growth over the same period were: Mexico 307, Austria 107, Belgium 42, South Korea, and 16 France.
The top 10 countries with the highest imports from January to September 2026 are: Japan with 136,652 vehicles, Germany with 66,438 vehicles, 28,350 US vehicles, Slovakia 20,422 vehicles, UK 18803, Mexico 4974, Austria 4193, Thailand 2,270, Italy 786, and South Korea with 760 vehicles. Among them, the top five that increased over the same period were: Thailand 2027, Austria, 1948, Mexico 1,576, China 540, and South Africa 373.
3. National characteristics of NEV imports
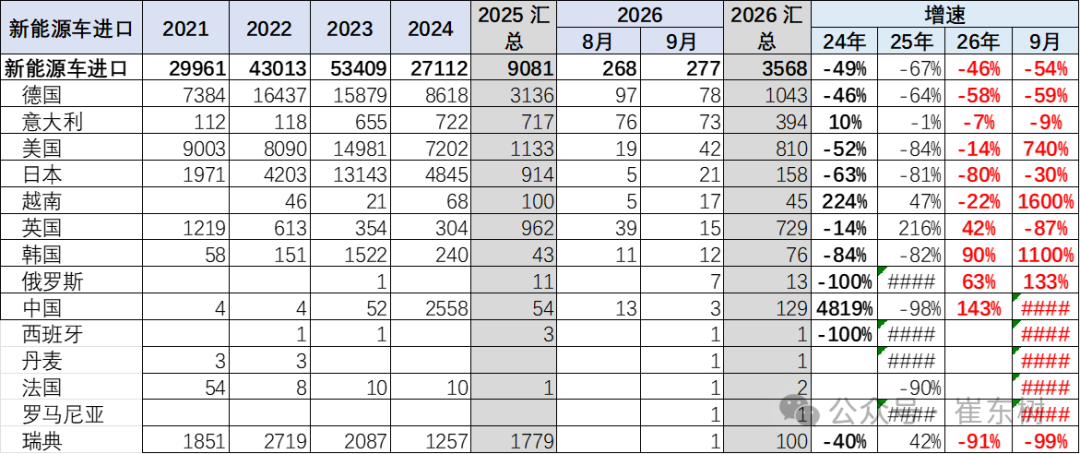
Domestic cars are more competitive in 2025, and imports of new energy vehicles from major importers fell 67%. The pressure to import new energy passenger cars in 2026 is still high. Cars imported from Germany are very poor, and there is basically no sales volume of new energy imported from Japan and the US.
III. The sales pattern of the automobile market
1. Overall sales volume of imported cars
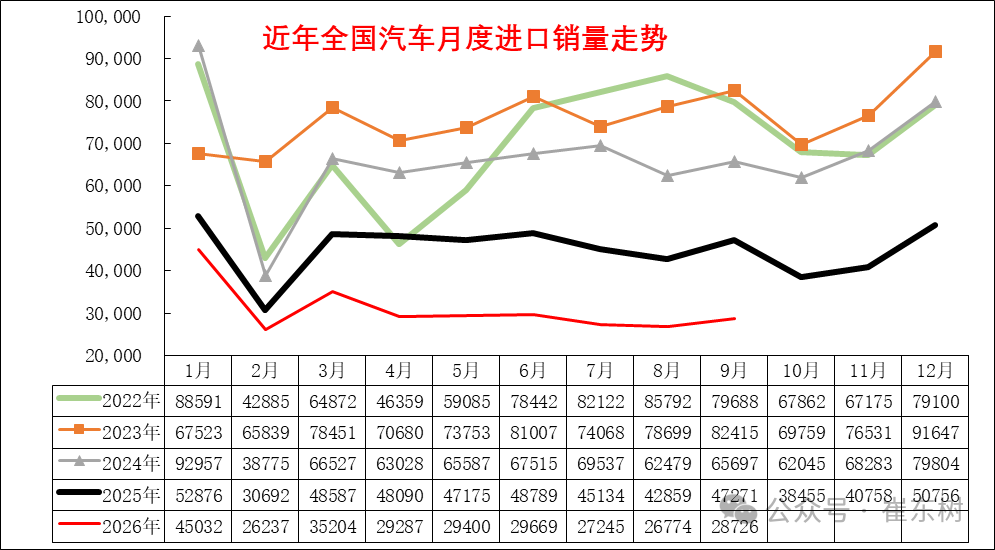
Imported cars were slightly lower than last year's trend in January-September. The decline was less than the trend in previous years. Imported fuel vehicles performed well at the beginning of the year, sales were poor in the 2nd quarter, and the trend continued to decline in September.
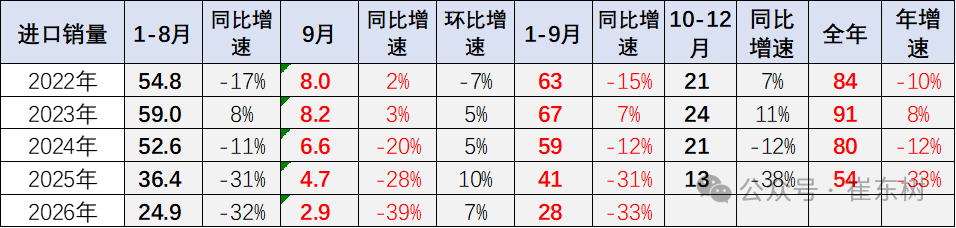
Due to the strength of China's autonomous car companies, the sales performance of imported cars continues to deteriorate, and it is also weaker than the trend in the domestic luxury car market.
The sales volume of imported cars from 2022 to 2024 is hovering between 800,000 and 900,000 units, and market pressure is gradually increasing. In 2025, the imported vehicle traffic insurance data was 540,000 vehicles, a decrease of 33% over the previous year. Due to the promotion of a low base in early 2025, imported cars sold 280,000 units in January-September this year, with a 32% drop of poor performance. The performance of falling 39% to 29,000 vehicles in September is very poor, and the pressure is still high.
2. Characteristics of imported car brands
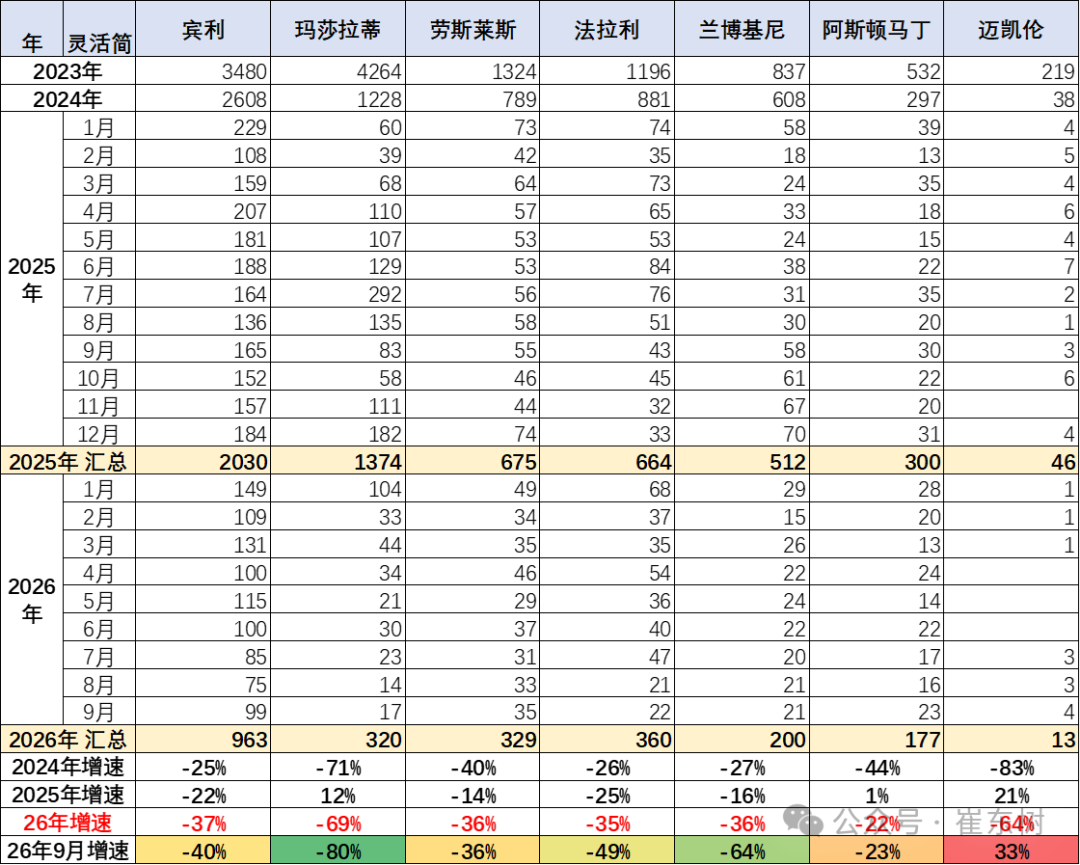
Imported ultra-luxury cars have continued to grow in the past few years, but there has been a major decline since 2023. The decline accelerated in 2024, and the decline from January to September 2026 is still severe. The trend of ultra-luxury fluctuated greatly. Maserati's overall trend in 2025 was abnormally high and declined in 2026. The trend of Bentley and Rolls-Royce is sluggish, but they have returned to leading positions in ultra-luxury. Lamborghini and Ferrari performed stronger. The overall weakening of ultra-luxury reflects a temporary slowdown in the purchasing power of ultra-high-end consumers, abnormal sales of ultra-luxury cars caused by early sell-offs, and a reasonable return to market prices.
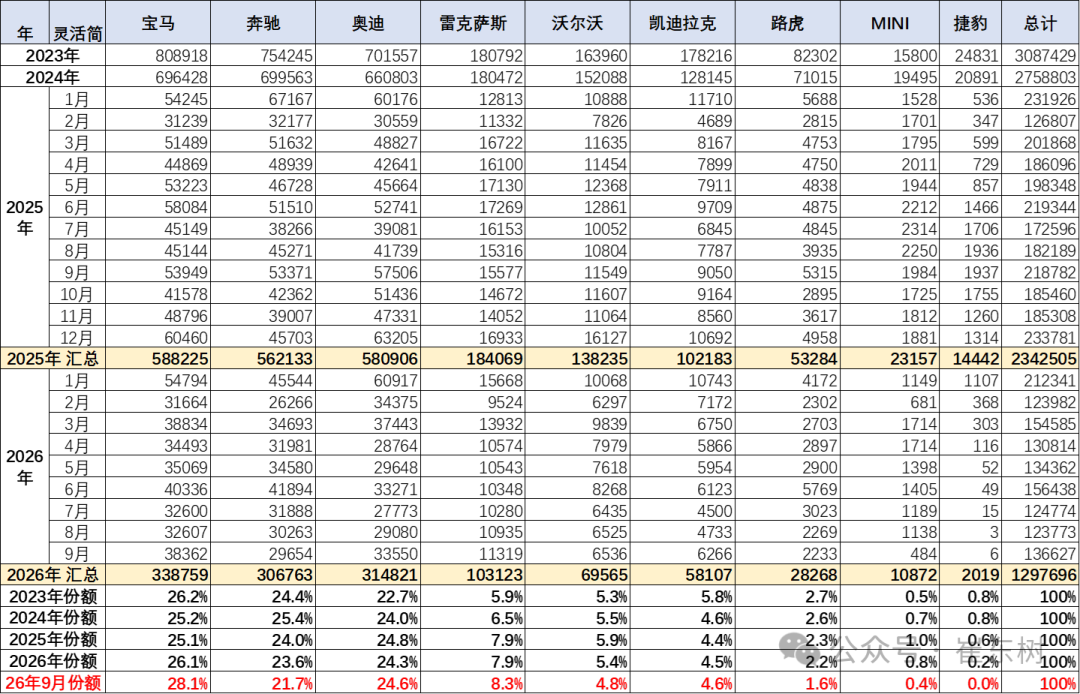
Currently, imported cars are mainly supported by demand for luxury cars, and non-luxury imported cars are shrinking sharply. Among imported cars, the share of the main imported luxury cars has increased dramatically. Imported cars from joint venture brands are shrinking rapidly, and imported cars from some brands, such as European cars imported from Volkswagen, are shrinking drastically.
Lexus's retail sales data for imported insurance in 2025 was 184,000 units, up 2% year on year. The share reached 37.6% of imported luxury cars, and Lexus' sales volume in 2025 was higher than 2022 sales, and remained at the level of 180,000 units for three consecutive years from 2022 to 2024.
Lexus's luxury car market share was 8.3% in September 2026, up about 0.4 percentage points from 7.9% in 2025. The overall performance of BMW, Porsche, and Land Rover was relatively good.
3. Characteristics of regional changes in imported ultra-luxury car brands
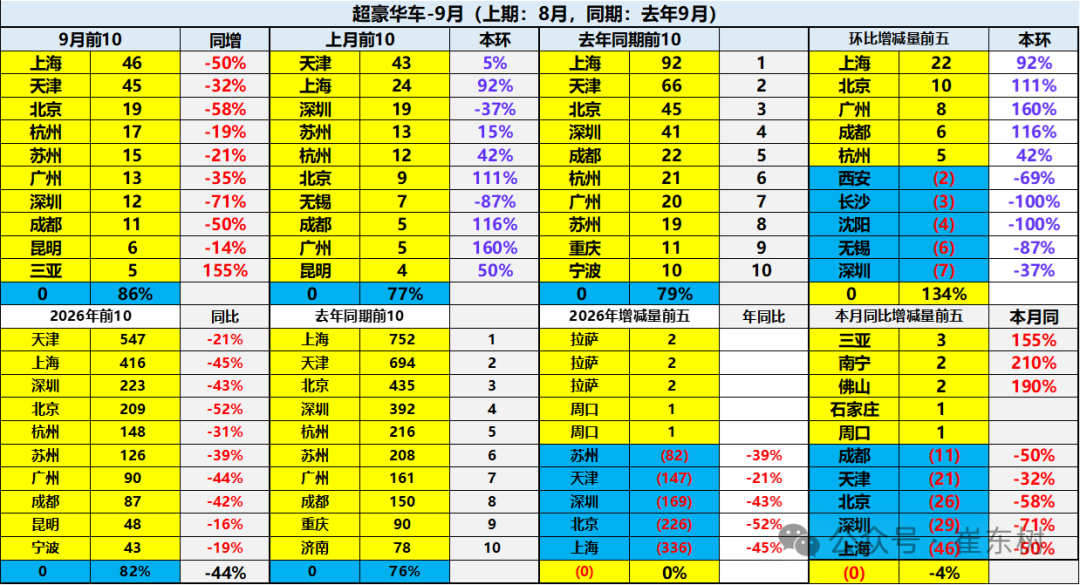
Demand in the ultra-luxury market for imported cars is generally weak. Shanghai is number one for ultra-luxury cars, Tianjin is stronger for imported cars, and Beijing has recently declined significantly.
The imported ultra-luxury car market is under high pressure in traditional affluent regions such as Shanghai, Beijing, Shenzhen, and Suzhou. The impact of new energy vehicles on ultra-luxury is reflected in the fact that due to the contraction of the ultra-luxury market, market demand is generally poor, and the price system is under high pressure.
4. Regional change characteristics of luxury cars
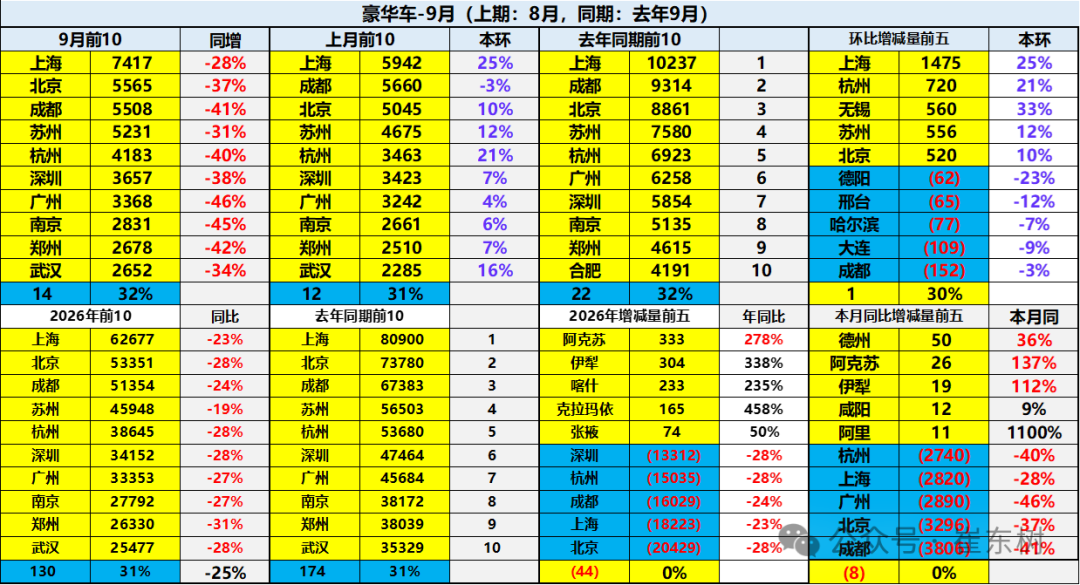
Demand in the domestic and imported luxury car markets is generally weak. Among them, the luxury car market in traditional affluent regions such as Beijing, Shanghai, Hangzhou, Chengdu, and Shenzhen is under high pressure. This year, petroleum producing regions in northern and central western China, such as Xinjiang and Shandong, are strong.