
Banner (BANR) Faces A Valuation Test After Third Quarter Earnings Miss
Banner Corporation (BANR) has swung into focus after third quarter results landed below analyst expectations for both revenue and earnings per share, despite modest year on year top line growth and pressure from merger expenses.
Despite the softer quarter, Banner’s share price tells a more mixed story, with an 8.93% year to date share price gain and a 10.35% 1 year total shareholder return. The 86.53% 3 year total shareholder return points to earlier momentum that has cooled more recently.
See how Banner compares with other regional lenders under pressure by exploring a curated set of 31 resilient stocks with low risk scores with resilient balance sheets and steadier recent performance trends.
Banner now trades at a clear discount to both analyst targets and one estimate of fair value, yet the latest earnings miss still lingers in the background. Is that gap mispricing caution around Banner, or reflecting it accurately?
Most Popular Narrative: 10.3% Undervalued
Banner last closed at $68.05, while the most followed narrative anchors fair value at $75.83. As a result, the current quote sits below that modeled range and places more emphasis on what the bank can already show on its balance sheet and income statement than on broader regional themes.
The main factor that has to go right is that Banner turns its higher operating expenses from technology and integration work into sustained efficiency gains without undermining its moderate risk profile and credit quality.
The current numbers on earnings, capital returns, and balance sheet strength imply a share price that may not fully reflect this combination of core profitability, low-cost funding, and consolidation potential.
See why 1 investors see Banner as 10% undervalued.
Result: Fair Value of $75.83 (UNDERVALUED)
Still, Banner’s higher technology and integration costs, along with the uncertain payoff from the Pacific Financial acquisition, leave real room for that valuation gap to persist.
Find out about the key risks to this Banner narrative.
Another View: How Banner Screens On P/E
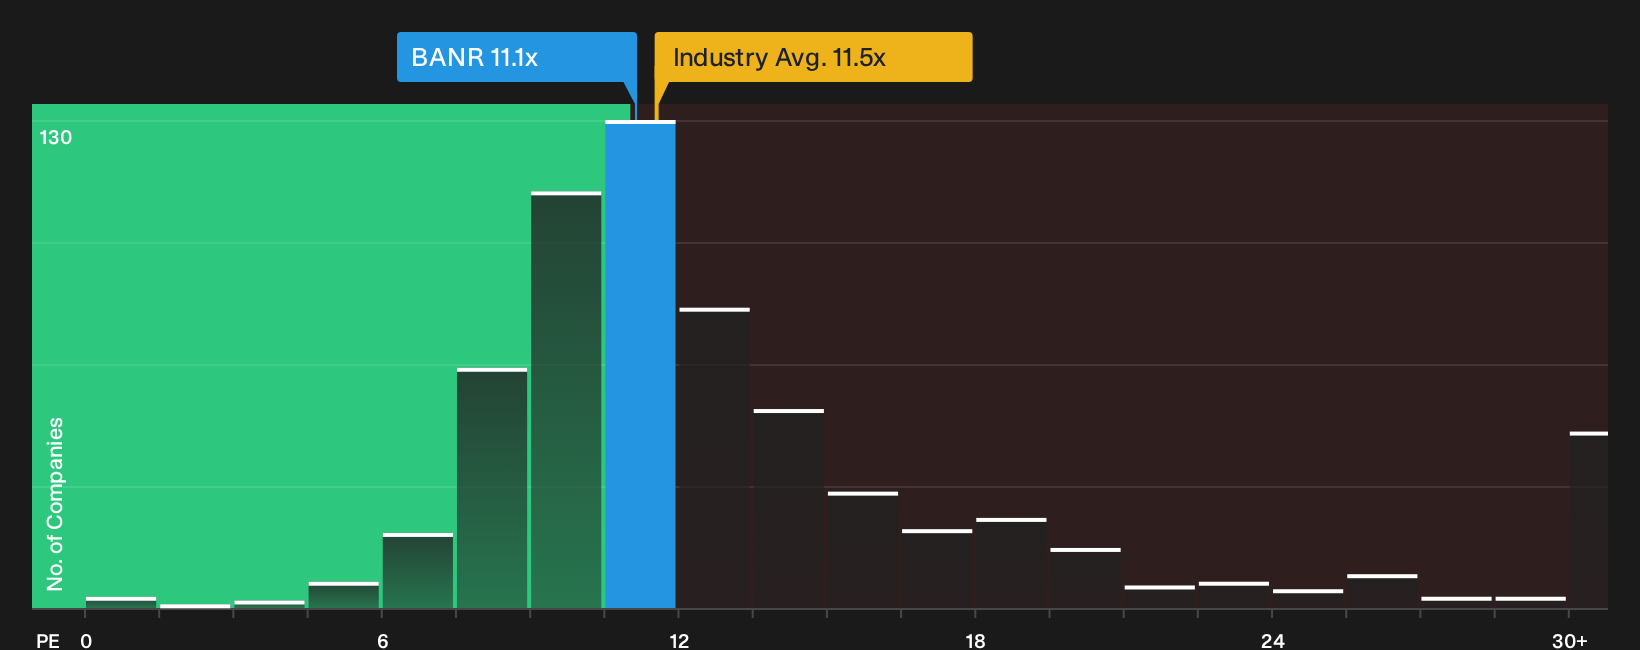
On a simple earnings multiple, Banner looks cheaper than the wider US Banks group but slightly richer than its direct peer set. The stock trades on an 11.1x P/E versus 11.5x for the industry, while the peer average sits at 10.8x, and the fair ratio sits higher at 12.1x. That mix suggests relatively contained downside if sentiment weakens, while also raising the question of whether the market needs to move closer to that fair ratio at all.
To see how this price tag compares with earnings power under different scenarios, See what the numbers say about this price — find out in our valuation breakdown.
Next Steps
Mixed signals or a clear opportunity, you can only answer that by weighing the upside and the red flags for yourself. To stress test your view against both the potential and the concerns that other investors are weighing, start by reviewing the 2 key rewards and 1 important warning sign.
Looking for more Banner investment ideas?
If Banner has your attention, do not stop at one ticker. Use the Simply Wall Street Screener to line up fresh ideas before the crowd gets there.
- Target potential mispricing by scanning a focused set of 33 high quality undervalued stocks that combine quality fundamentals with marked-down share prices.
- Strengthen your defensive side by reviewing a list of solid balance sheet and fundamentals (25 results) that can help anchor your portfolio when conditions get choppy.
- Get ahead of the herd by checking a curated 21 high quality undiscovered gems that the broader market may not be paying close attention to yet.
Have feedback on this article? Concerned about the content? Get in touch with us directly. Alternatively, email editorial-team@simplywallst.com