
Is Nasdaq (NDAQ) A Bargain On Earnings Growth Expectations?
Nasdaq (NDAQ) heads into today’s third quarter earnings release with expectations centered on higher revenue and profit, as investors focus on growth in financial crime technology, capital markets solutions, listings activity, and data-related sales.
Recent trading has tilted more positive for Nasdaq, with a 1-day share price return of 1.39% and a 7-day share price gain of 4.52% taking the stock to US$96.12 ahead of earnings. That short burst sits against a year-to-date share price move that is slightly down 0.56%, while total shareholder return of 11.40% over one year and very large 3-year and 5-year total shareholder returns of 102.22% and 52.63% may indicate that investors have already been rewarded for believing in the longer-term shift toward technology, data and financial crime solutions.
Spot 21 high quality undiscovered gems that, like Nasdaq, lean on data, technology, and recurring revenue to turn exchange and market infrastructure into long-term compounding stories.Bulls point to Nasdaq’s tech and data tilt, as well as steady earnings expectations. Bears see a richly rewarded track record already in the price after the recent bounce. Which case does the current valuation lean toward?
Most Popular Narrative: 8% Undervalued
Nasdaq's most followed valuation story pegs fair value around $104.19 per share, which sits above the recent $96.12 close and frames the earnings print against a market that is still debating how much of the tech and data shift is already in the price.
Four crashes, four different causes, four different recovery timelines, two years, fifteen years, years, months. If there were a reliable way to know in real time which kind you were in, that would be worth more than almost anything else in investing. Nobody has reliably had that in any of these four cases. What every one of them rewarded instead was the boring stuff, not being leveraged past what you could survive, having a plan for how much you were willing to lose before you needed to act on it, and not needing to guess correctly about the recovery shape to avoid being wiped out waiting for it.
See why 6 investors see Nasdaq as 8% undervalued.
According to zonedinout, that narrative fair value implies Nasdaq trades at roughly an 8% discount, even after strong multi year total returns. The quoted discount rate of 8.15% sets a fairly demanding hurdle for future cash flows and still points to upside based on that long term cash generation view rather than short term trading outcomes.
Revenue forecasts of about 7.2% a year and a projected profit margin near 35% sit behind that story, with a future P/E of roughly 27.2 used to translate those earnings into the $104.19 figure. The key idea is that recurring data, index and financial crime technology fees can support those margins through different market cycles, which is why the narrative leans on surviving crashes rather than trying to time them.
For investors weighing the current $96.12 price against that narrative, the spread is not huge in percentage terms but it is meaningful when combined with Nasdaq's existing scale of about $5.6b in annual sales and $1.97b in net income. The valuation story effectively argues that if those earnings forecasts are met under a reasonable discount rate, today's quote leaves some room before pricing in the full long term cash flow profile.
Result: Fair Value of $104.19 (UNDERVALUED)
Still, Nasdaq's story leans heavily on continued appetite for its fraud detection and data platforms, and any slowdown in listings or trading activity could challenge that cash flow narrative.
Find out about the key risks to this Nasdaq narrative.
Another View: Nasdaq Through A Cash Flow Lens
The first Nasdaq story relies on earnings and a future P/E of about 27x to argue for fair value near $104.19. A very different picture comes from our DCF model, which puts future cash flow value closer to $33.05, well below the current $96.12 share price and firmly in overvalued territory on that measure.
The gap between an 8% discount to $104.19 and a DCF value of $33.05 is significant in practical terms, because it shows how sensitive any Nasdaq thesis is to long term cash flow assumptions, discount rates, and reinvestment returns. The question becomes simple for investors: Which lens feels more realistic for how this business turns $5.6b of annual revenue into cash over decades?
Look into how the SWS DCF model arrives at its fair value.
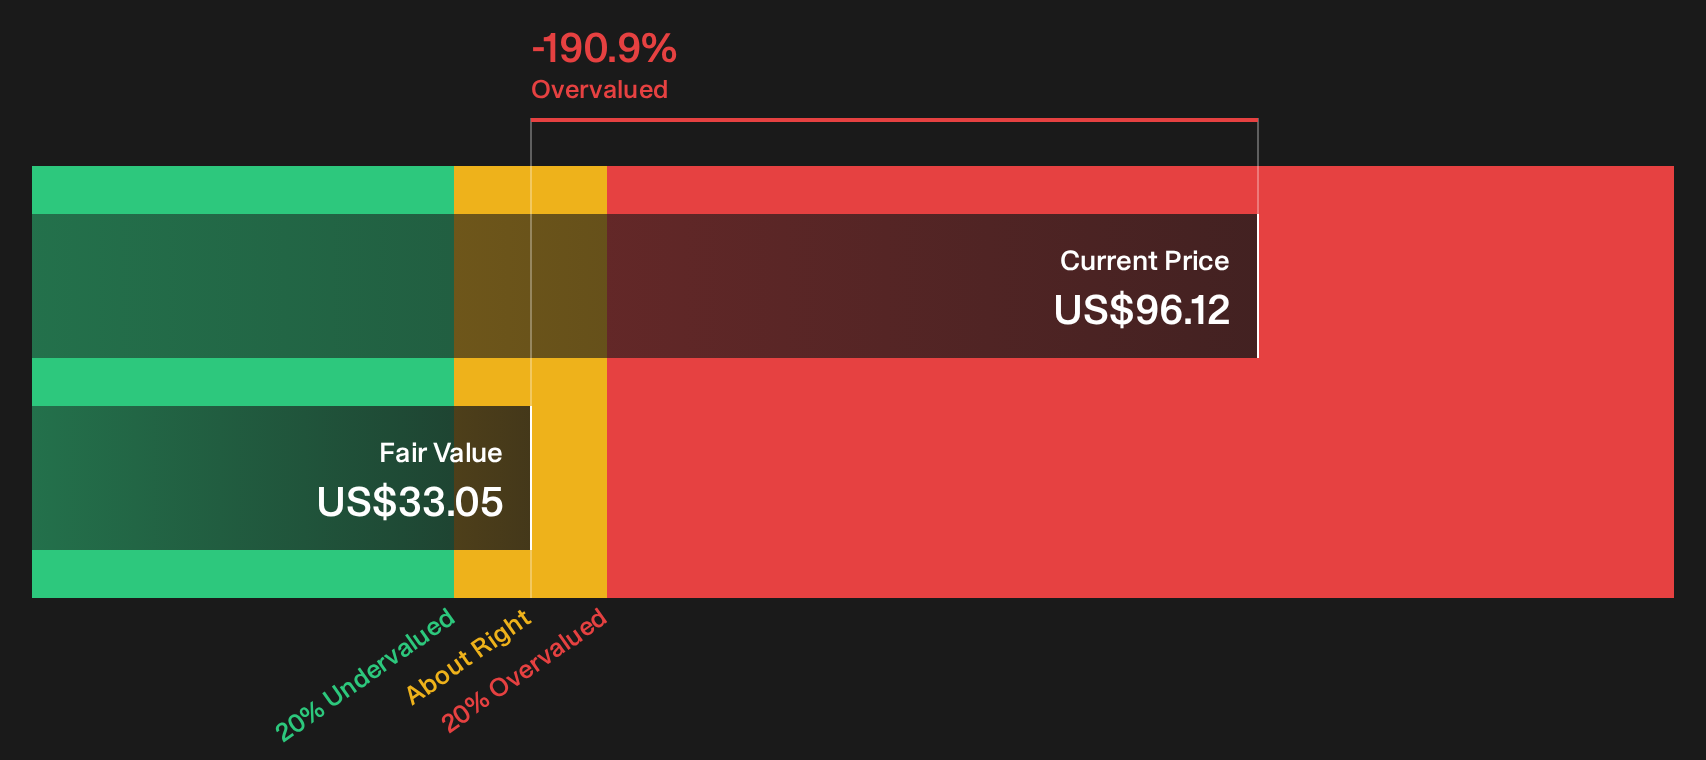
Simply Wall St performs a discounted cash flow (DCF) on every stock in the world every day (check out Nasdaq for example). We show the entire calculation in full. You can track the result in your watchlist or portfolio and be alerted when this changes, or use our stock screener to discover 33 high quality undervalued stocks. If you save a screener we even alert you when new companies match - so you never miss a potential opportunity.
Next Steps
Mixed messages on Nasdaq can be useful if you treat them as a prompt rather than an answer. Move quickly, pull up the charts, and weigh those cash flow stories, earnings assumptions, and sentiment shifts against your own risk tolerance, then pressure test that view against the 3 key rewards and 2 important warning signs.
Looking for more investment ideas beyond Nasdaq?
Nasdaq's competing valuation stories are useful, but your next move does not need to stop here. Broaden the opportunity set and let the data do more of the heavy lifting.
- Target potential value gaps by scanning a curated 33 high quality undervalued stocks that combines quality fundamentals with market pessimism that may have gone too far.
- Protect your downside first and let upside take care of itself by focusing on a 31 resilient stocks with low risk scores built around resilient balance sheets and lower volatility profiles.
- Get ahead of the crowd by screening for a 21 high quality undiscovered gems before attention and capital flows narrow the margin for error.
Have feedback on this article? Concerned about the content? Get in touch with us directly. Alternatively, email editorial-team@simplywallst.com