
QCR Holdings (NASDAQ:QCRH) Reports Sales Below Analyst Estimates In Q3 2026 Earnings

Midwest regional bank QCR Holdings (NASDAQGM:QCRH) missed Wall Street’s revenue expectations in Q3 2026, with sales falling 11.7% year on year to $99.17 million. Its non-GAAP profit of $2.21 per share was 5.7% above analysts’ consensus estimates.
Is now the time to buy QCR Holdings? Find out by accessing our full research report, it’s free.
QCR Holdings (QCRH) Q3 2026 Highlights:
- Net Interest Income: $68.69 million vs analyst estimates of $70.1 million (6% year-on-year growth, 2% miss)
- Net Interest Margin: 3.6% vs analyst estimates of 3.6% (2.3 basis point beat)
- Revenue: $99.17 million vs analyst estimates of $108.8 million (11.7% year-on-year decline, 8.9% miss)
- Efficiency Ratio: 55.2% vs analyst estimates of 53.9% (131.3 basis point miss)
- Adjusted EPS: $2.21 vs analyst estimates of $2.09 (5.7% beat)
- Tangible Book Value per Share: $61.79 vs analyst estimates of $62.95 (10.8% year-on-year growth, 1.8% miss)
- Market Capitalization: $1.60 billion
“Over the past 12 months, we have strategically sold and securitized loans to recycle capital, support additional LIHTC originations, and generate attractive fee income without requiring corresponding balance sheet growth. By recycling this capital into new originations, we generated $67.5 million of capital markets revenue while increasing net interest income by $24.3 million or 10% compared to the preceding 12-month period. This demonstrates our ability to grow both net interest income and capital markets revenue while operating with a smaller balance sheet and deploying capital more efficiently,” said Mr. Gipple.
Company Overview
With roots dating back to 1993 and a name reflecting its original Quad Cities market, QCR Holdings (NASDAQGM:QCRH) operates four community banks across Iowa and Missouri, providing commercial, consumer banking, and trust services to businesses and individuals.
Sales Growth
Net interest income and fee-based revenue are the two pillars supporting bank earnings. The former captures profit from the gap between lending rates and deposit costs, while the latter encompasses charges for banking services, credit products, wealth management, and trading activities. Regrettably, QCR Holdings’s revenue grew at a tepid 7.6% compounded annual growth rate over the last five years. This was below our standard for the banking sector and is a tough starting point for our analysis.
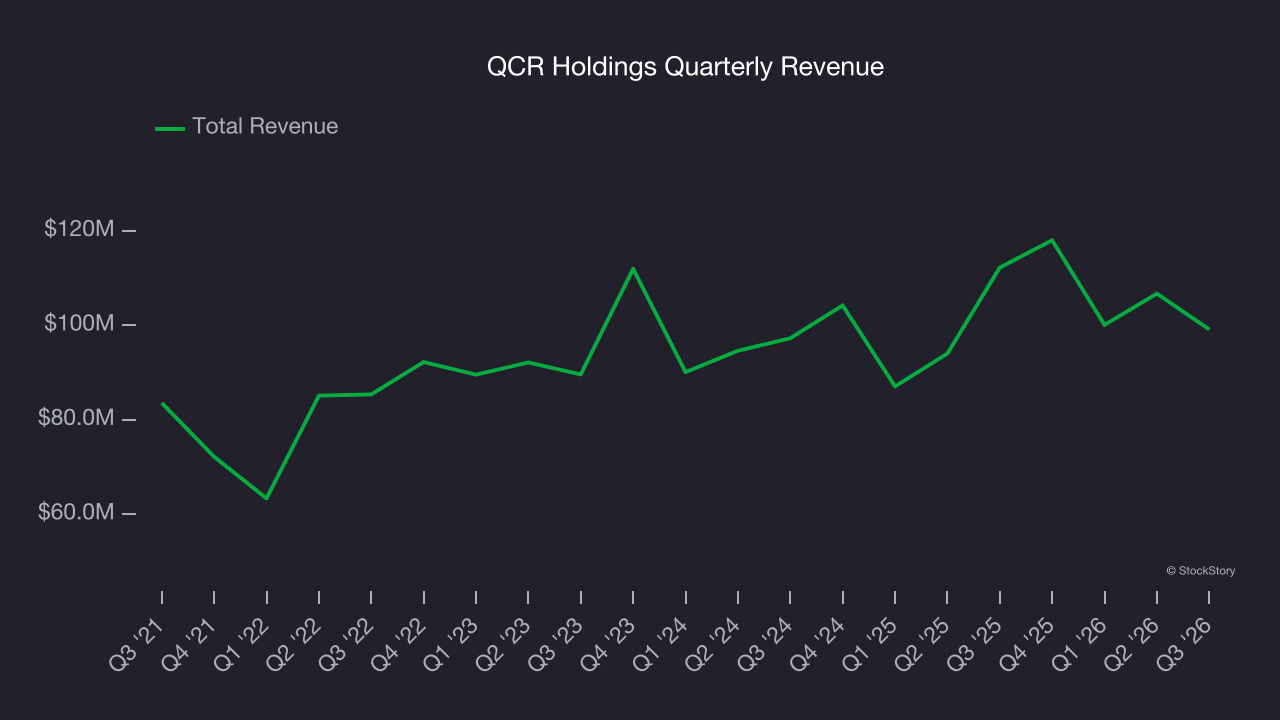
Long-term growth is the most important, but within financials, a half-decade historical view may miss recent interest rate changes and market returns. QCR Holdings’s recent performance shows its demand has slowed as its annualized revenue growth of 3.7% over the last two years was below its five-year trend. We’re wary when companies in the sector see decelerations in revenue growth, as it could signal changing consumer tastes aided by low switching costs. 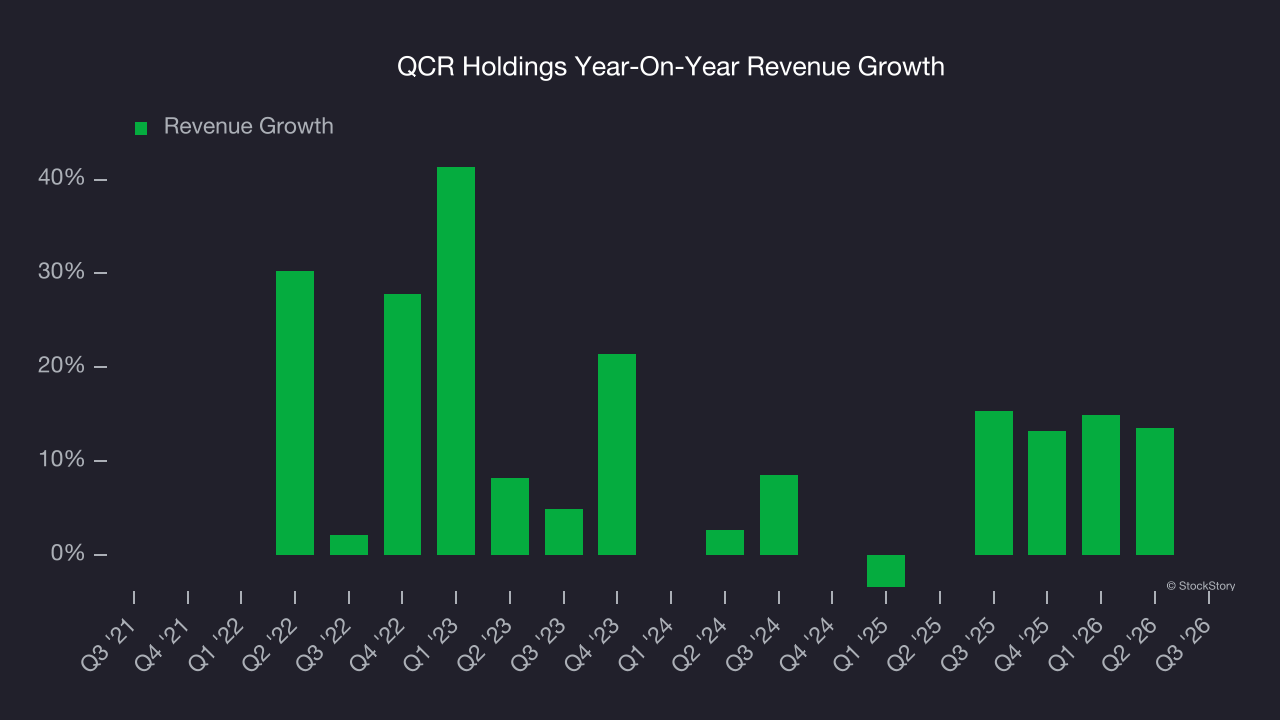 Note: Quarters not shown were determined to be outliers because they were impacted by outsized investment gains/losses that are not indicative of the recurring fundamentals of the business.
This quarter, QCR Holdings missed Wall Street’s estimates and reported a rather uninspiring 11.7% year-on-year revenue decline, generating $99.17 million of revenue.
Net interest income made up 66.8% of the company’s total revenue during the last five years, meaning lending operations are QCR Holdings’s largest source of revenue.
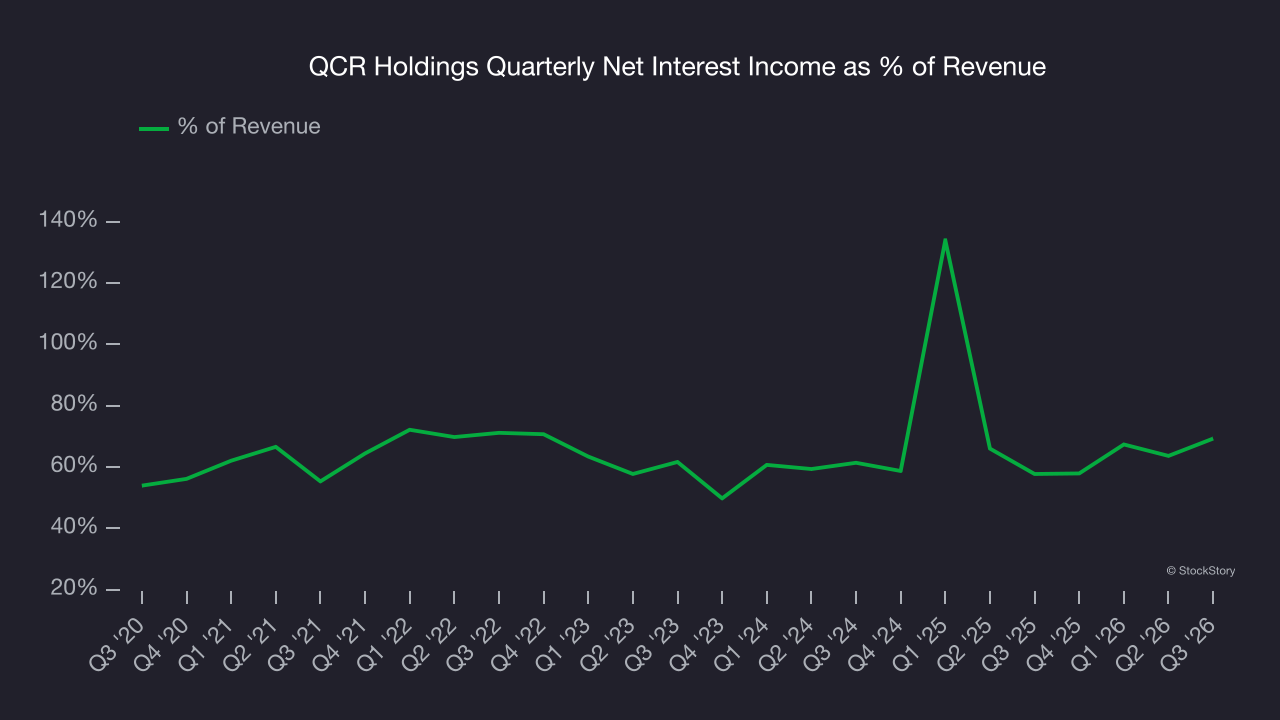
Markets consistently prioritize net interest income growth over fee-based revenue, recognizing its superior quality and recurring nature compared to the more unpredictable non-interest income streams.
ONE MORE THING: The $21 AI Application Stock Wall Street Forgot. While Wall Street obsesses over who’s building AI, one company is already using it to print money. And nobody’s paying attention.
AI chip stocks trade at ridiculous valuations. This company processes a trillion consumer signals monthly using AI and trades at a third of the price. The gap won’t last. The institutions will figure it out. You need to see this first. Read the FREE Report Before They Notice.
Tangible Book Value Per Share (TBVPS)
The balance sheet drives banking profitability since earnings flow from the spread between borrowing and lending rates. As such, valuations for these companies concentrate on capital strength and sustainable equity accumulation potential.
This explains why tangible book value per share (TBVPS) stands as the premier banking metric. TBVPS strips away questionable intangible assets, revealing concrete per-share net worth that investors can trust. On the other hand, EPS is often distorted by mergers and flexible loan loss accounting. TBVPS provides clearer performance insights.
QCR Holdings’s TBVPS grew at an incredible 11.2% annual clip over the last five years. TBVPS growth has also accelerated recently, growing by 12.3% annually over the last two years from $49.00 to $61.79 per share.
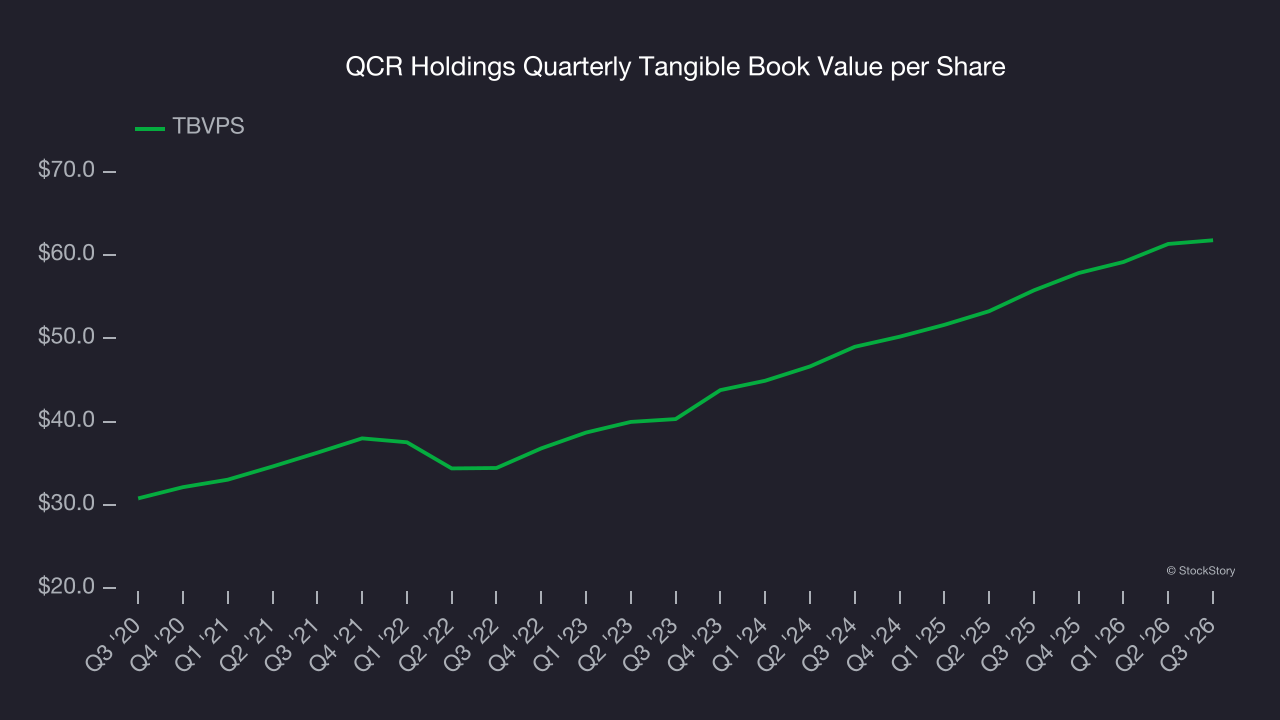
Over the next 12 months, Consensus estimates call for QCR Holdings’s TBVPS to grow by 14.3% to $70.60, decent growth rate.
Key Takeaways from QCR Holdings’s Q3 Results
We struggled to find many positives in these results. Its revenue missed and its net interest income fell short of Wall Street’s estimates. Overall, this quarter could have been better. The stock remained flat at $99.41 immediately after reporting.
Is QCR Holdings an attractive investment opportunity right now? When making that decision, it’s important to consider its valuation, business qualities, as well as what has happened in the latest quarter. We cover that in our actionable full research report which you can read here (it’s free).