
11.5x P E Makes Cheniere Energy Partners (CQP) Worth A Look Following Sabine Pass Focus
Renewed interest in Cheniere Energy Partners (CQP) has been sparked by fresh attention on its multi year returns, its long term contract revenue model, and the planned Sabine Pass Expansion decision expected in 2027.
Recent trading has been quieter for Cheniere Energy Partners, with a 1 month share price return of down 1.9% and a relatively flat 3 month move. At the same time, the year to date share price return of 17.8% and 5 year total shareholder return of 100.4% keep the broader trend pointing to momentum built over several years rather than short term swings around the latest Sabine Pass or valuation headlines.
See how Cheniere Energy Partners compares with other contract-backed energy plays by reviewing our hand picked 16 nuclear energy infrastructure stocks, which also focus on large scale infrastructure and long term projects.
After a 5 year total return of 100.4% and a recent year to date gain of 17.8%, is most of Cheniere Energy Partners’ upside already reflected in the price, or does the current 11.5x P/E still leave meaningful room for further gains?
Price-to-Earnings of 11.5x: Is it justified?
Valuation for Cheniere Energy Partners currently leans on a P/E of 11.5x, which sits below both its direct peer group and the wider US market, even after a $63.63 last close and strong multi year total returns.
The P/E ratio compares the current share price to annual earnings per unit, so for a business like Cheniere Energy Partners it reflects how much investors are paying for every dollar of LNG cash generation already in place. For assets tied to long term contracts and infrastructure, P/E often indicates how much weight the market is putting on the durability of those earnings rather than on rapid expansion.
Relative to similar oil and gas operators on 20.6x, an 11.5x multiple points to a marked discount. The gap to the US market on 18.1x is also wide. Against the sector average of 12.5x, the LNG partnership still trades cheaper. Compared with an estimated fair P/E of 14.6x, the current valuation level could move closer to that fair ratio if sentiment and fundamentals stay aligned with recent performance.
Explore the SWS fair ratio for Cheniere Energy Partners.
Result: Price-to-Earnings of 11.5x (UNDERVALUED)
Still, the revenue growth rate of 3.4%, alongside declining net income growth of 4.4% and reliance on a single LNG terminal, leaves Cheniere Energy Partners exposed if contract dynamics or project economics shift.
Find out about the key risks to this Cheniere Energy Partners narrative.
Another View: SWS DCF Model Flags A Very Different Picture
The P/E story for Cheniere Energy Partners looks friendly, yet the SWS DCF model tells a far tougher story. On that framework, an estimated future cash flow value of $2.42 per unit versus a $63.63 price screens as sharply overvalued. Which lens deserves more weight in your own process?
Look into how the SWS DCF model arrives at its fair value.
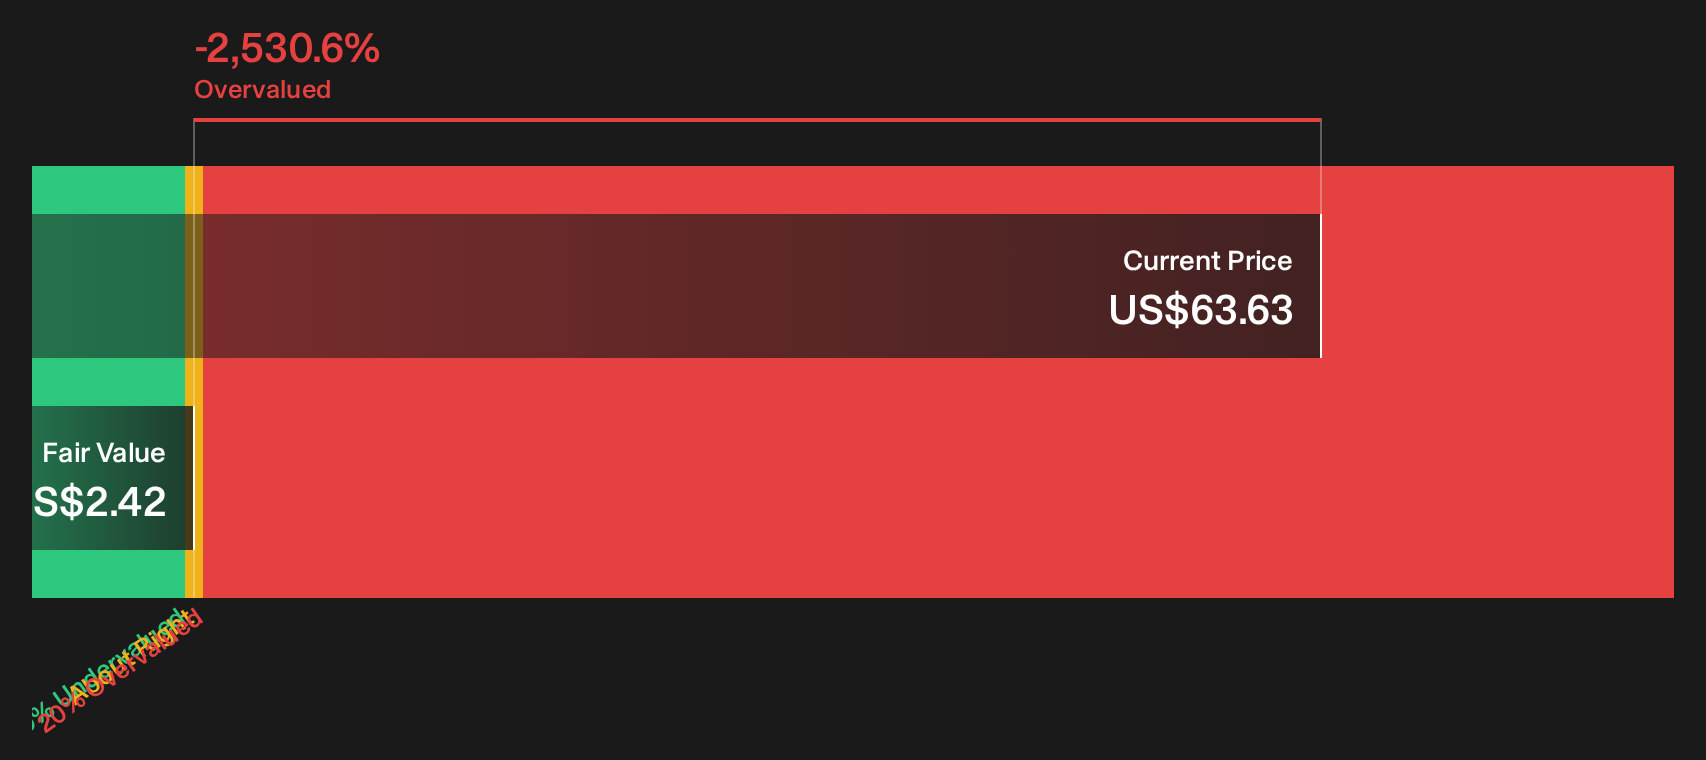
Simply Wall St performs a discounted cash flow (DCF) on every stock in the world every day (check out Cheniere Energy Partners for example). We show the entire calculation in full. You can track the result in your watchlist or portfolio and be alerted when this changes, or use our stock screener to discover 35 high quality undervalued stocks. If you save a screener we even alert you when new companies match - so you never miss a potential opportunity.
Next Steps
Mixed signals on Cheniere Energy Partners so far, with valuation, cash flow and contract risk all pulling in different directions, mean you should move quickly and weigh the full picture yourself by reviewing the 3 key rewards and 3 important warning signs
Looking for more investment ideas beyond Cheniere Energy Partners?
Cheniere Energy Partners may already be on your radar, but some powerful opportunities only show up when you scan the wider market with a focused tool.
- Target resilient cash generators by reviewing our 35 high quality undervalued stocks that pair solid fundamentals with prices that still look restrained.
- Strengthen your income stream by checking a curated 8 dividend fortresses built around higher yields and sustainable payout profiles.
- Guard against painful surprises by focusing on a 32 resilient stocks with low risk scores that highlights businesses with sturdier balance sheets and lower risk scores.
Have feedback on this article? Concerned about the content? Get in touch with us directly. Alternatively, email editorial-team@simplywallst.com