
Oil Above $111 Puts Japan Petroleum Exploration Stock And Energy Cash Flow In Focus
Oil above $111, fresh geopolitical flashpoints and talk of more strategic reserve releases have turned the energy story from background noise into front-page risk. Pricing power, balance sheets and dividends suddenly matter a lot more. This piece walks through three integrated oil and gas producers from our screener that are closely tied to these headlines, and shows how the same news could either support or challenge an investment case you might be considering today.
The three stocks below are just a starting sample, and the same filters applied across the integrated oil and gas universe surfaced 43 more producers with equally compelling stories that are not covered here.
If you want to go straight to the source and identify, compare and analyze those opportunities for yourself, head into the Global Integrated Oil & Gas Producers screener.
New Hope (ASX:NHC)
Overview: New Hope Corporation develops and operates coal mines in Queensland and New South Wales, exporting thermal coal to power and industrial customers worldwide. This ties its fortunes closely to global energy pricing rather than the full oil and gas value chain.
Operations: New Hope generates about A$1.7b in segment revenue, mainly from New South Wales coal mining at A$1.2b and Queensland coal operations at A$511 million, with smaller contributions from other activities.
Market Cap: A$5.2b
New Hope fits this energy producer screen as a coal specialist, providing direct exposure to thermal fuel pricing at scale while still meeting the size and balance sheet thresholds that sit behind the screener rules.
"Management’s view that underinvestment in new thermal coal projects, aging global coal assets and growing power demand will leave seaborne markets short of supply creates scope for New Hope to sell a greater share of output at pricing closer to recent spot levels, which would feed directly into revenue and EBITDA."
The key variable is how one unresolved pressure on coal-linked cash flow ultimately shapes margins, dividend capacity and valuation reset potential.
That pressure point is exactly what the full narrative for New Hope unpacks, separating short term cash swings from longer term thesis drivers that could be getting overlooked.

Thungela Resources (JSE:TGA)
Overview: Thungela Resources is a pure thermal coal miner in South Africa and Australia that supplies large export customers across Asia, the Middle East and Africa. This gives the business direct exposure to global energy security concerns within an integrated energy-focused screener.
Operations: Thungela Resources generates most of its ZAR31.0b revenue from South African underground and opencast mines, alongside ZAR7.7b from Australian underground production, with diversified export markets led by India, other export destinations and Taiwan.
Market Cap: ZAR16.7b
Thungela Resources slots into this energy screen as a coal specialist with scale, export reach and balance sheet metrics that tie directly into global fuel tightness. Rising Brent prices and energy security worries are putting this dynamic back in focus.
"The recent recovery in Transnet’s North Corridor rail performance to an annualised run rate close to 60 million tonnes creates room for Thungela Resources to deepen third party coal throughput beyond the current 0.6 to 0.7 million tonnes. This could turn logistics access into a fee-earning and margin-accretive service line alongside own-mine exports, supporting revenue and net margins."
The test now is how one shift in where and how those tonnes move ultimately shapes earnings resilience and dividend potential.
That hinges on whether Transnet’s improvement is a blip or a trend. This is exactly what the full narrative for Thungela Resources lays out, including where earnings durability could be accelerating.

Japan Petroleum Exploration (TSE:1662)
Overview: Japan Petroleum Exploration runs a multi region oil and natural gas business, spanning upstream production, LNG infrastructure and lower carbon energy projects.
Operations: The group generates about ¥235.4b revenue from Japan, ¥51.7b from North America and ¥30.9b from the Middle East, with smaller European contributions.
Market Cap: ¥437.8b
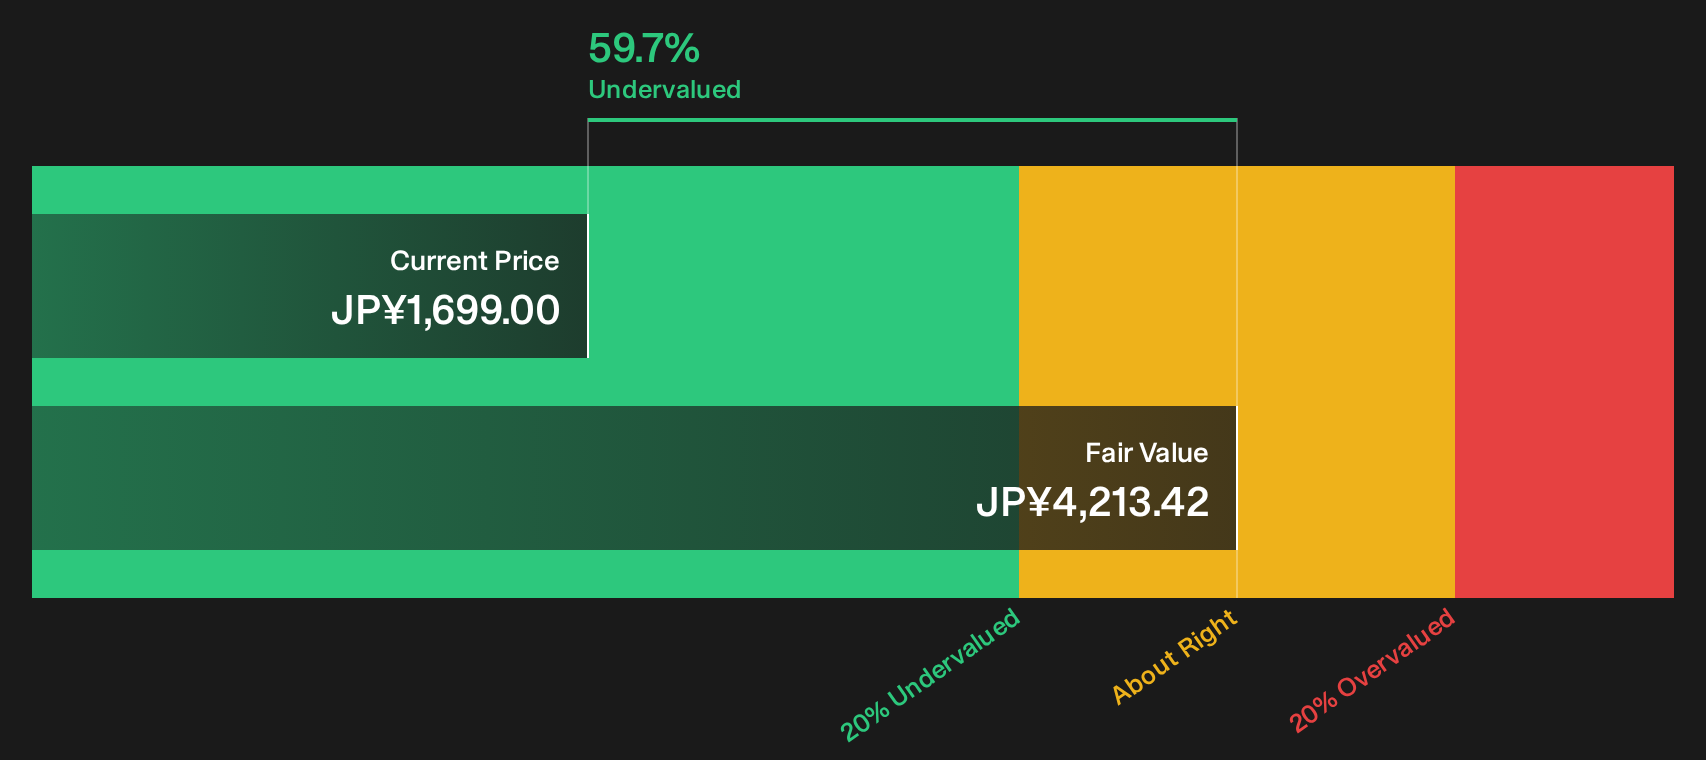
Japan Petroleum Exploration fits the Global Integrated Oil & Gas Producers screen as a diversified hydrocarbon producer with LNG, power and renewables activities, direct leverage to Brent above $111, and a share price trading well below estimated fair value. Investors focused on valuation gaps and multi region exposure may watch how one unseen pressure on profitability and dividends ultimately reshapes that discount.
That potential reset starts with valuation, so step through the DCF valuation analysis for Japan Petroleum Exploration to see how any pressure on cash flows could be getting mispriced.
Seeking Alternatives Before The Window Closes
Fresh opportunities can move from quiet to flying under the radar and then to fully caught by the crowd quickly. Scan for breakout potential while it matters and act now.
- Target durable income from companies that aim to keep paying out even when conditions get rough by reviewing the 5 dividend fortresses.
- Spot early momentum where AI revenues are growing faster than the story by running through the curated 39 profitable AI stocks that aren't just burning cash.
- Track powerful crosswinds in energy, defense and electrification by scanning the hand picked 16 nuclear energy infrastructure stocks.
Have feedback on this article? Concerned about the content? Get in touch with us directly. Alternatively, email editorial-team@simplywallst.com