
Berkshire Hathaway (BRK.B) Is Drawing Fresh Attention, What Is Behind It?
Berkshire Hathaway (BRK.B) continues to trade around its recent close of US$532.23, drawing attention as investors weigh annual revenue of US$384.7b against net income of US$85.8b and mixed profit trends.
Recent trading has leaned positive, with a 7-day share price return of 2.8% and a 90-day share price gain of 8.7%, while Berkshire Hathaway’s 1-year total shareholder return of 7.7% sits against a much stronger 3-year total shareholder return of 58.0%. This suggests that longer term momentum has been stronger than the more recent trend.
Scan how Berkshire Hathaway compares with other financial powerhouses by checking a hand picked set of list of solid balance sheet and fundamentals (25 results) that focus on resilience rather than hype.
Berkshire Hathaway has just added another short burst of gains on top of a much stronger three year run. Does buying after this move still leave enough value on the table, or does patience make more sense?
Preferred Multiple of 13.3x P/E: Is it justified?
Berkshire Hathaway screens as attractively priced on earnings, with a P/E of 13.3x that sits well below both peers and the wider Diversified Financial industry, even after the share price strength of the past few years.
The P/E ratio compares what investors are paying today for each dollar of current earnings. For a diversified group like Berkshire Hathaway that spans insurance, rail, utilities, and manufacturing, this metric gives a clean way to line up its earnings valuation against other large financial and industrial groups.
Here the current 13.3x P/E looks restrained when set against the peer average of 23.2x and the US Diversified Financial industry at 17.1x. The estimate of a fair P/E around 14.7x also sits above the current level, which indicates the market is pricing Berkshire Hathaway at a discount to what its earnings profile and quality might support if sentiment were to shift closer to that fair ratio level.
Explore the SWS fair ratio for Berkshire Hathaway.
Result: Price-to-Earnings of 13.3x (UNDERVALUED)
Still, annual net income growth has moved lower even as revenue growth remains positive. Berkshire Hathaway’s wide mix of cyclical businesses can magnify that pressure if conditions tighten.
Find out about the key risks to this Berkshire Hathaway narrative.
Another View on Berkshire Hathaway’s Value
There is a second lens investors often reach for. Our DCF model, which values Berkshire Hathaway on future cash flows, points to a fair value of about $790.76 per share compared with the current $532.23 price. That signal also frames the stock as undervalued, so which story do you trust more: earnings multiples or long range cash flow math?
Look into how the SWS DCF model arrives at its fair value.
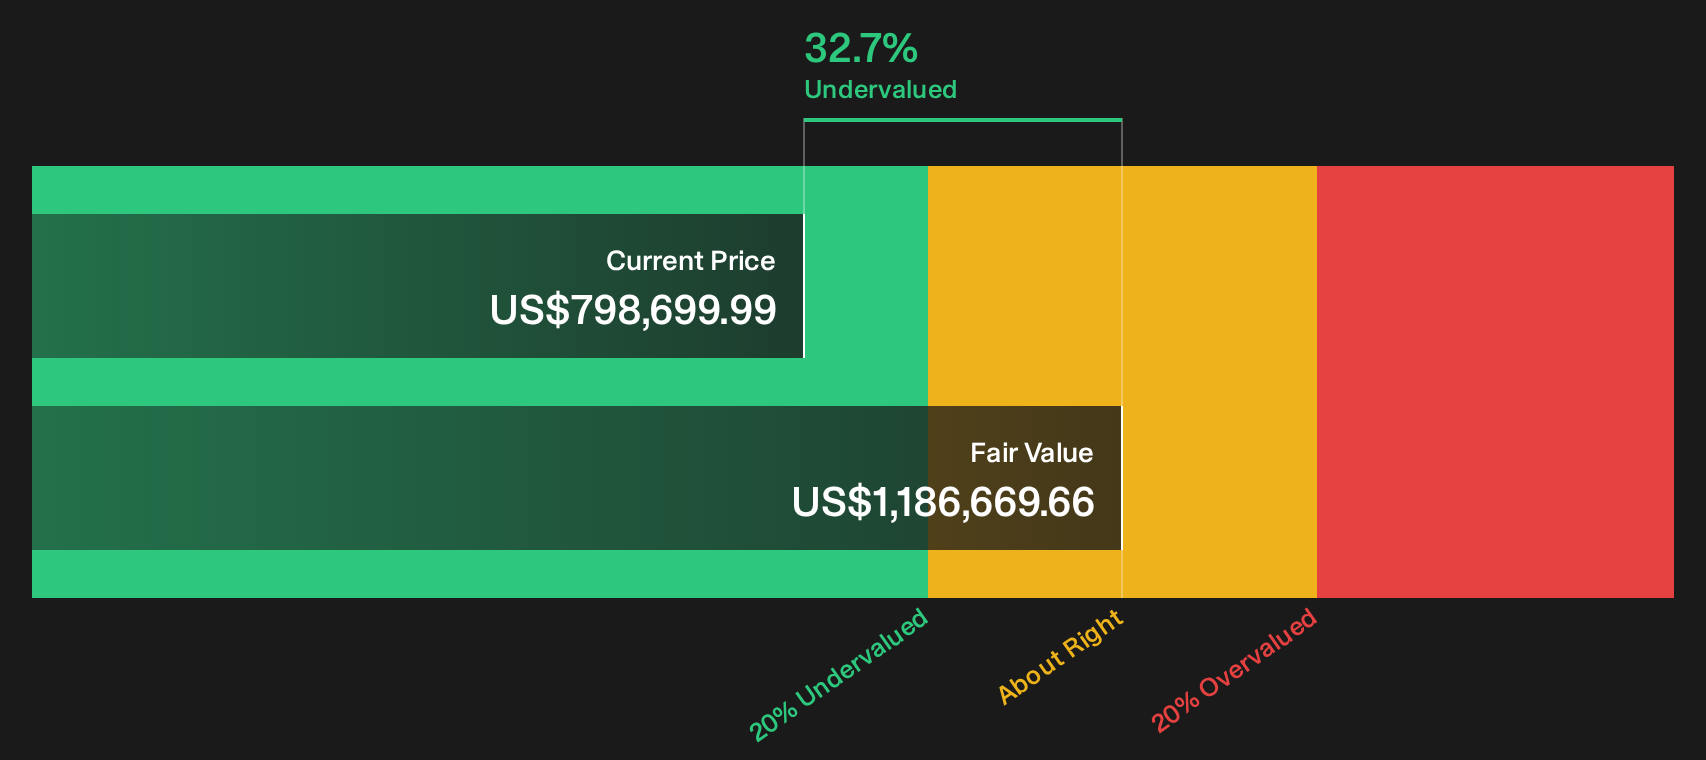
Simply Wall St performs a discounted cash flow (DCF) on every stock in the world every day (check out Berkshire Hathaway for example). We show the entire calculation in full. You can track the result in your watchlist or portfolio and be alerted when this changes, or use our stock screener to discover 35 high quality undervalued stocks. If you save a screener we even alert you when new companies match - so you never miss a potential opportunity.
Next Steps
If this mix of potential risks and rewards around Berkshire Hathaway feels finely balanced, move quickly to review the numbers yourself, evaluate the assumptions, and weigh the 3 key rewards and 1 important warning sign.
Looking for more Berkshire Hathaway investment ideas?
If Berkshire Hathaway has sharpened your focus, do not stop here. Broader ideas can help you pressure test your thinking and spot opportunities you might otherwise miss.
- Target potential mispricings by reviewing a 35 high quality undervalued stocks that pairs solid fundamentals with valuations the market has not fully rewarded yet.
- Secure more predictable cash returns by scanning a 8 dividend fortresses that filters for income strength alongside business resilience.
- Prioritise capital preservation with a 32 resilient stocks with low risk scores that highlights companies scoring strongly on balance sheet and risk metrics.
Have feedback on this article? Concerned about the content? Get in touch with us directly. Alternatively, email editorial-team@simplywallst.com