
Hubbell (HUBB) Could Be 17% Undervalued As Earnings Confidence Builds
Hubbell (HUBB) heads into its next earnings report on October 27, 2026, with recent quarters showing earnings coming in ahead of expectations and current indicators pointing to continued analyst confidence in near term results.
Recent trading paints a mixed picture for Hubbell. The 1 month share price return of 4.03% contrasts with a 90 day share price decline of 3.13%. At the same time, the 1 year total shareholder return of 9.02% and 3 year total shareholder return of 72.34% point to momentum that has built over a longer stretch as investors weigh its earnings track record against current expectations.
Scan beyond Hubbell and see how it stacks up against a hand picked 43 power grid technology and infrastructure stocks that is shaping the next leg of earnings driven grid modernization.
Bulls point to Hubbell’s earnings beat streak and long term total return, while bears focus on the recent pullback and a rich grid story that may already be priced in. Which case does the valuation math support next?
Most Popular Narrative: 17% Undervalued
Hubbell’s most followed narrative pegs fair value at $563.25, comfortably above the last close of $464.92. This raises the stakes for how the next few years of grid and data center spending play out.
The emerging build out of 550 to 765 kV high voltage transmission, with management pointing to a roughly US$1.5b industry opportunity over 10 years and initial 550 kV and 765 kV shipments starting between late 2026 and 2027, introduces a new revenue layer that can lift Hubbell’s long term earnings power.
See why 17 investors see Hubbell as 17% undervalued.
Result: Fair Value of $563.25 (UNDERVALUED)
Still, the Hubbell story can crack if higher post NSI interest costs bite harder than expected, or if Electrical Solutions margins struggle to regain recent pressure points.
Find out about the key risks to this Hubbell narrative.
Another Lens On Hubbell’s Valuation
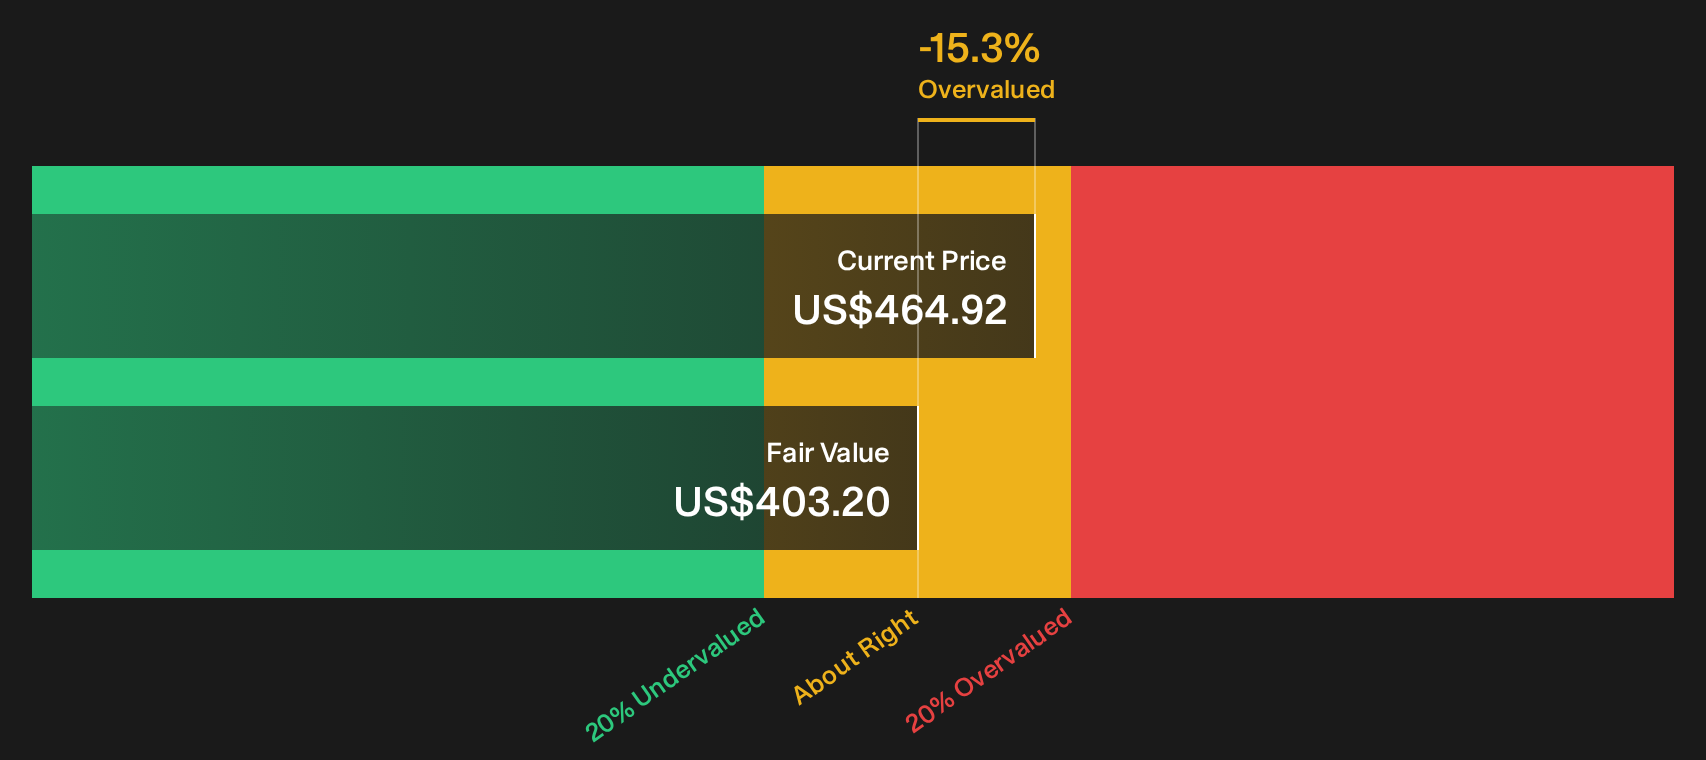
The Simply Wall St DCF model tells a different story for Hubbell. On that framework, the estimated future cash flow value sits at $403.20, below the recent share price of $464.92, which points to an overvalued signal and raises questions about how much optimism is already baked in.
Understanding how this cash flow view is built can help you decide which story feels more realistic for your own assumptions, Look into how the SWS DCF model arrives at its fair value.
Simply Wall St performs a discounted cash flow (DCF) on every stock in the world every day (check out Hubbell for example). We show the entire calculation in full. You can track the result in your watchlist or portfolio and be alerted when this changes, or use our stock screener to discover 35 high quality undervalued stocks. If you save a screener we even alert you when new companies match - so you never miss a potential opportunity.
Next Steps
Mixed messages on value and risk can feel uncomfortable, yet they are exactly where thoughtful investors do their best work. Act while sentiment is divided and weigh Hubbell’s mix of concerns and potential upside across 4 key rewards and 1 important warning sign.
Hunting For More Ideas Beyond Hubbell?
If Hubbell has you thinking harder about where to put fresh capital next, do not stop at a single grid story when other opportunities are lining up.
Use the Simply Wall St screener to widen your field of options and compare your thinking against different types of businesses and balance sheets.
- Target resilient payers that prioritise income security by reviewing 8 dividend fortresses backed by solid fundamentals and meaningful cash distributions.
- Identify potential quality at a discount by scanning the 35 high quality undervalued stocks that combine strong financial profiles with prices below intrinsic estimates.
- Focus on 32 resilient stocks with low risk scores that carry lower risk scores and may help steady your portfolio when sentiment swings.
Have feedback on this article? Concerned about the content? Get in touch with us directly. Alternatively, email editorial-team@simplywallst.com