
Is Evergy (EVRG) Undervalued Or Are Its Data Center Hopes Already Priced In?
Evergy (EVRG) has drawn fresh attention after recent share moves, with the price closing at US$81.69. You are now considering how that level compares with the utility’s recent performance.
Recent trading tells a mixed story. The share price has eased over the past day but still shows an 11.78% year-to-date share price return. The 1-year total shareholder return of 7.49% and 3-year total shareholder return of about 9x suggest longer term momentum has been stronger than in the latest quarter.
Scan beyond Evergy and compare its recent momentum with a curated set of utilities and other resilient operators screened as 32 resilient stocks with low risk scores.
Evergy has already delivered strong multi year gains, yet the recent run to US$81.69 still leaves a gap between market price and some value markers. How much of the potential is already in the rear view mirror?
Most Popular Narrative: 10.5% Undervalued
On the widely followed narrative view, Evergy’s fair value sits at $91.27, comfortably above the recent $81.69 close. This puts today’s price against a backdrop of contracted demand, a large build program and defined funding plans.
Strong anticipated growth in electricity demand from large-scale data centers, advanced manufacturing such as Panasonic's EV battery plant, and other commercial users remains central to Evergy's outlook, with signed long-term agreements totaling about 3 GW of large-load demand that are expected to support future revenue and earnings as these customers ramp through 2030.
See why 14 investors see Evergy as 10% undervalued.
Result: Fair Value of $91.27 (UNDERVALUED)
Still, Evergy’s heavy capital plan, funded with both debt and fresh equity, plus any shortfall in large data center load materializing, could quickly challenge that optimistic narrative.
Find out about the key risks to this Evergy narrative.
Another View: SWS DCF Signals a Very Different Fair Value
The analyst narrative describes Evergy as about 10.5% undervalued at $81.69 compared with a $91.27 fair value. The SWS DCF model presents a different view. On that cash flow basis, Evergy is trading above an estimated $61.25 per share future cash flow value, which points to an overvalued outcome instead. Which lens feels more convincing for you: earnings or cash flows?
To see how those cash flow assumptions are built and test them against your own expectations, Look into how the SWS DCF model arrives at its fair value.
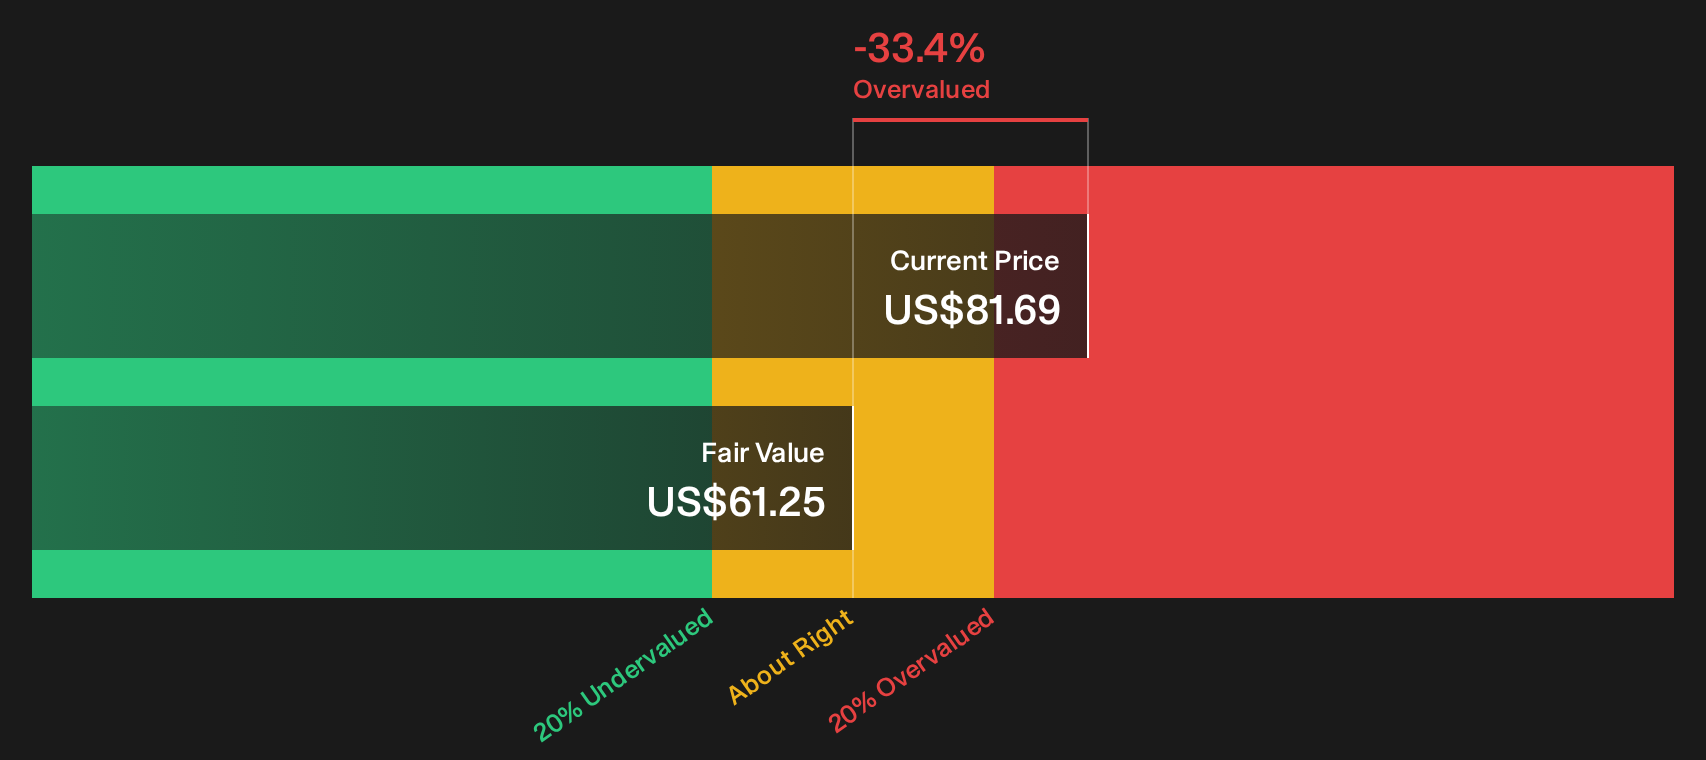
Simply Wall St performs a discounted cash flow (DCF) on every stock in the world every day (check out Evergy for example). We show the entire calculation in full. You can track the result in your watchlist or portfolio and be alerted when this changes, or use our stock screener to discover 35 high quality undervalued stocks. If you save a screener we even alert you when new companies match - so you never miss a potential opportunity.
Next Steps
Mixed messages so far, right, with Evergy showing both enthusiasm and concern in the data, so move quickly and weigh both sides by checking the 3 key rewards and 2 important warning signs.
Looking for more investment ideas beyond Evergy?
If Evergy has sharpened your thinking, do not stop here. Broader ideas can help you stress test your thesis and spot opportunities you might otherwise miss.
- Target resilient balance sheets and steadier fundamentals by reviewing the list of solid balance sheet and fundamentals (25 results) before capital flows elsewhere.
- Hunt for quality at a discount by checking the 35 high quality undervalued stocks that already pass strict fundamental filters.
- Get ahead of the crowd by scanning the 20 high quality undiscovered gems that fewer investors are watching but still show strong underlying numbers.
Have feedback on this article? Concerned about the content? Get in touch with us directly. Alternatively, email editorial-team@simplywallst.com