
AAR (AIR) Pulls Back From Recent Highs, Is The 36% Undervaluation Case Convincing?
AAR (AIR) has drawn investor attention after its recent share moves, with the price near US$98.59 and returns over the past month and past 3 months turning sharply negative.
Recent trading paints a mixed picture for AAR. The share price has retreated over the past month and quarter, yet the year to date share price return of 16.7% and the 1 year total shareholder return of 17.3% still point to longer term momentum that has not fully reversed.
Compare AAR's recent pullback with other hand picked aviation and defense contractors by scanning the list of solid balance sheet and fundamentals (25 results), which couples robust finances with potential share price inflection points.
AAR has retreated sharply while still trading far below analyst targets, which sets up a clear tension between discounted upside and market caution. Is that hesitation grounded once you line it up against fair value estimates?
Most Popular Narrative: 36% Undervalued
AAR's most followed narrative points to a fair value of $154.50 against the recent share price of $98.59, which places the current pullback alongside a substantially higher long run earnings view built around MRO scale, software, and government work.
The commercialization of additional MRO capacity in Oklahoma City and Miami, which were already sold out before opening, remains a live driver as those facilities are absorbed into the network and can feed more work into AAR’s parts, repair, and services platform. This may support higher revenue and steadier earnings.
See why 11 investors see AAR as 36% undervalued.
Result: Fair Value of $154.50 (UNDERVALUED)
Still, AAR’s story can break if MRO integration drags on margins, or if higher debt from the MRO Holdings deal constrains flexibility and cash generation.
Find out about the key risks to this AAR narrative.
Another View: What AAR's DCF Says
The analyst narrative frames AAR as 36% undervalued, yet the Simply Wall St DCF model points a different way. On that cash flow view, the shares at $98.59 sit above an estimated value of $77.99, which implies a premium and less room for error in the cash generation story.
To see how that cash based view is built and stress test the assumptions yourself, Look into how the SWS DCF model arrives at its fair value.
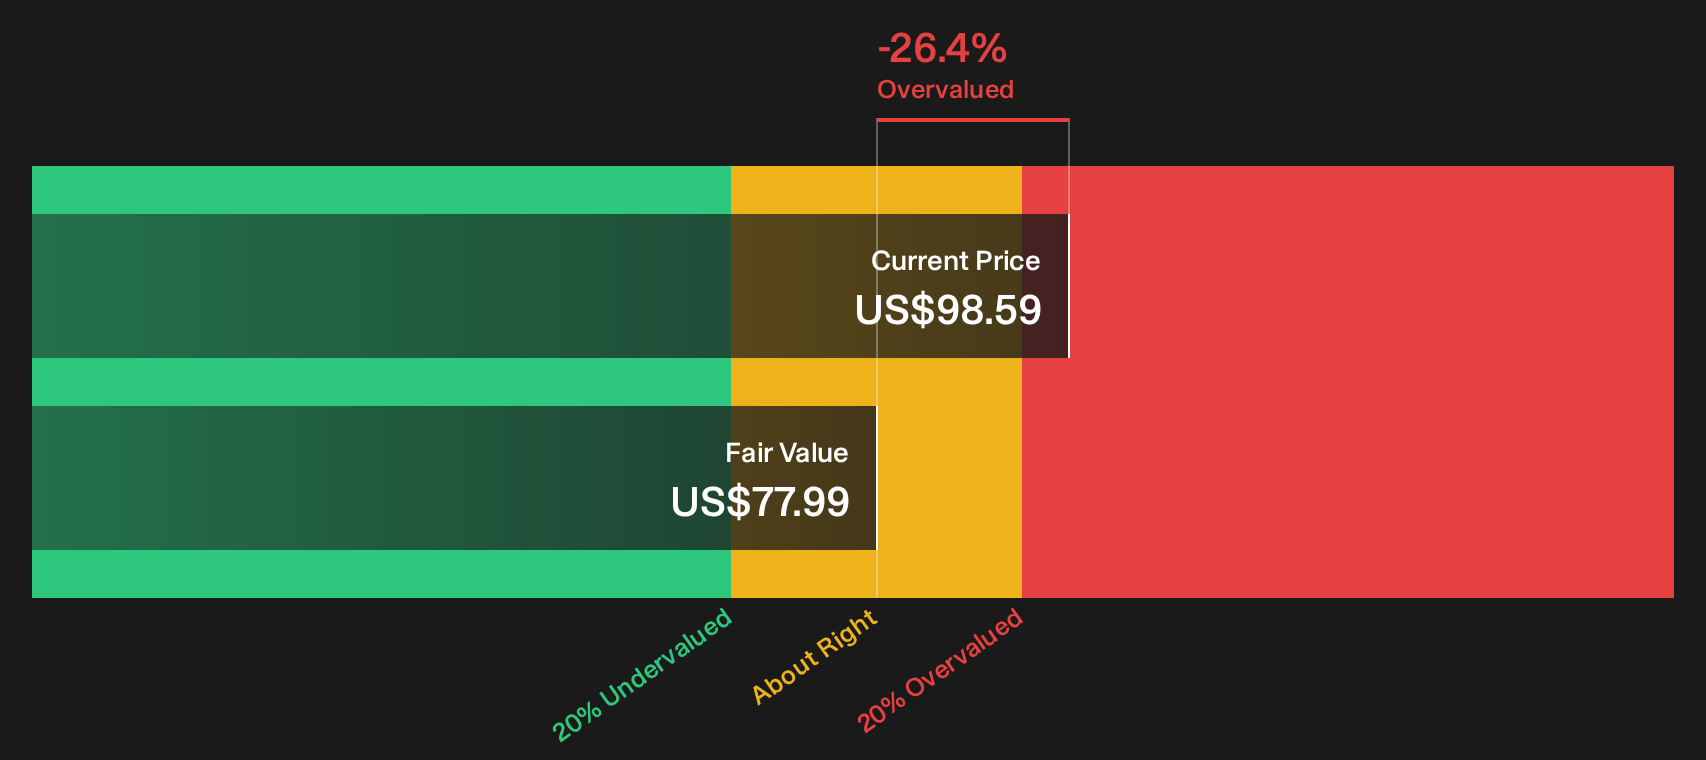
Simply Wall St performs a discounted cash flow (DCF) on every stock in the world every day (check out AAR for example). We show the entire calculation in full. You can track the result in your watchlist or portfolio and be alerted when this changes, or use our stock screener to discover 35 high quality undervalued stocks. If you save a screener we even alert you when new companies match - so you never miss a potential opportunity.
Next Steps
Mixed signals on AAR's value can be confusing, so check the underlying data, weigh the possible downside and upside, and ground your own judgment with the 5 key rewards and 1 important warning sign.
Looking for more investment ideas beyond AAR?
If AAR has sharpened your focus on value and risk, use the Simply Wall St screener to pressure test fresh ideas and avoid leaving potential opportunities on the table.
- Target robust balance sheets by scouting companies on the list of solid balance sheet and fundamentals (25 results) that pair financial strength with room for their investment story to develop.
- Hunt for mispriced quality by reviewing the 35 high quality undervalued stocks and see which businesses the numbers suggest may be trading below their underlying fundamentals.
- Prioritize resilience by scanning the 32 resilient stocks with low risk scores and focus on businesses with lower risk scores when you want steadier sleep at night.
Have feedback on this article? Concerned about the content? Get in touch with us directly. Alternatively, email editorial-team@simplywallst.com