
Is Maze Therapeutics (MAZE) Undervalued Or Is Its Recent Rebound Already Priced In?
Maze Therapeutics (MAZE) has drawn fresh attention after its recent share performance, with the stock up about 22% over the past month while still showing a decline over the past 3 months and year to date.
Recent trading paints a mixed picture for Maze Therapeutics. The stock’s 30-day share price return of about 22% suggests momentum has picked up again. However, the year-to-date share price return is still down roughly 31%, and the 1-year total shareholder return has declined about 7%.
Scan for other biotechs showing similar volatility and potential inflection points by reviewing our curated list of 33 healthcare AI stocks alongside Maze Therapeutics.
Bulls point to Maze Therapeutics’ revenue growth and the gap to analyst targets, while bears focus on ongoing losses and mixed recent returns. Which side does the current valuation structure appear to support next?
Most Popular Narrative: 56% Undervalued
The most followed narrative on Maze Therapeutics compares a fair value of about $62.55 against the last close at $27.53. This frames the recent rebound as only partially closing the gap that narrative followers see.
Progression of MZE829 from Phase II HORIZON data that showed a mean 36% uACR reduction in APOL1 mediated kidney disease and higher uACR reductions in the FSGS subgroup could support eventual label defining studies that expand Maze Therapeutics’ addressable patient pool and potential future revenue base.
See why 1 investors see Maze Therapeutics as 56% undervalued.
Result: Fair Value of $62.55 (UNDERVALUED)
Still, the Maze Therapeutics story can break if the expected swing from a US$133.6 million loss to positive earnings, or the high implied P/E, fails to materialise.
Find out about the key risks to this Maze Therapeutics narrative.
Another View: Maze Therapeutics Looks Expensive On P/B
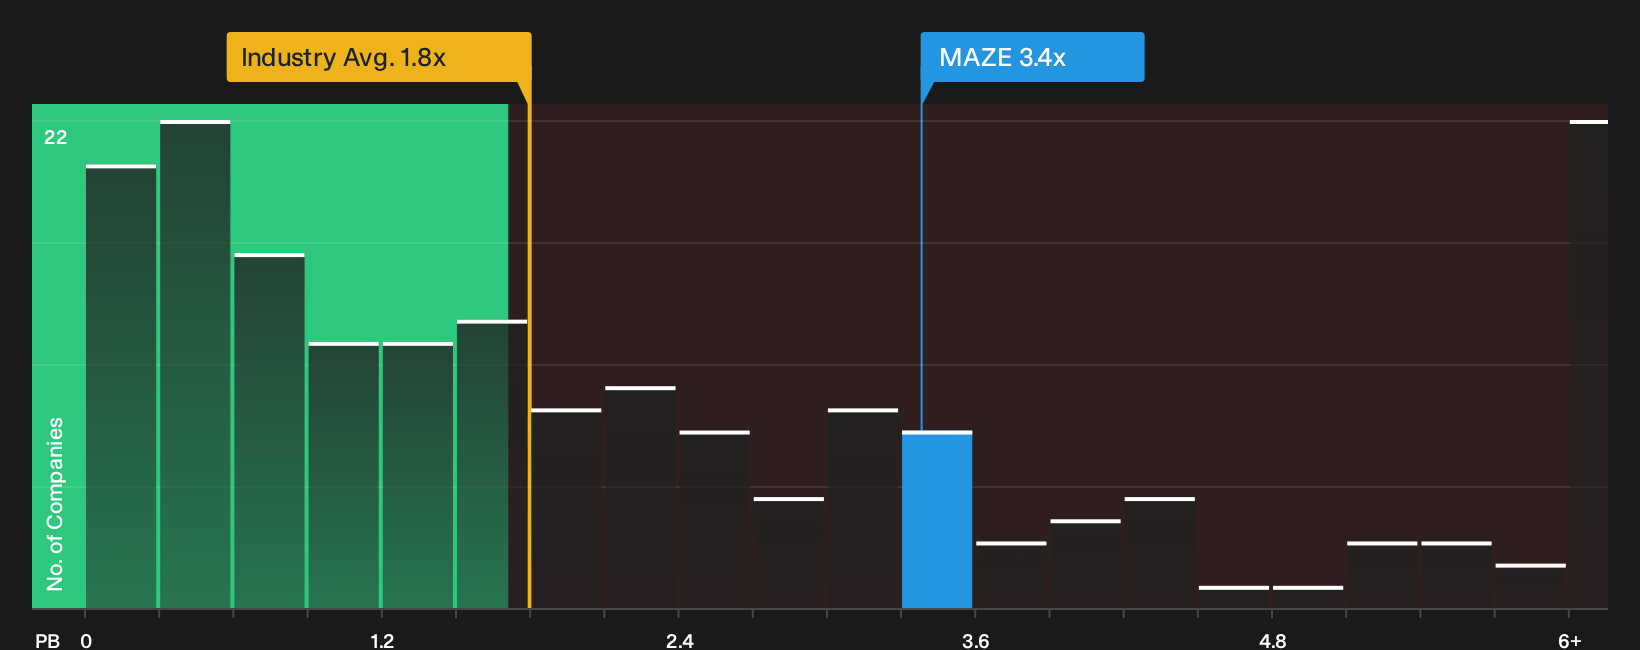
Multiples tell a very different story for Maze Therapeutics. The stock trades on a P/B of 3.4x, compared with 1.8x for the wider US Pharmaceuticals group and 2x for peers. That premium narrows the margin for error. If sentiment cools, the share price could drift closer to those benchmarks.
To see how this valuation premium compares with detailed ratio work, review the See what the numbers say about this price — find out in our valuation breakdown. before deciding how much risk you want to take on this kind of pricing.
Next Steps
Mixed signals or an early shift in sentiment; either way, it pays to look closely at Maze Therapeutics’ data and form your own view while others are still reacting. To weigh both sides of the story in one place, review the 1 key reward and 4 important warning signs.
Looking For More Investment Ideas Beyond Maze Therapeutics?
If Maze Therapeutics has caught your eye, do not stop there. Use the Simply Wall St screener to uncover fresh opportunities before they move without you.
- Target dependable cash generators that aim to share income with investors through 8 dividend fortresses.
- Hunt for mispriced quality by scanning the market for 33 high quality undervalued stocks.
- Prioritise resilience by zeroing in on companies with strong finances using our list of solid balance sheet and fundamentals (25 results).
This article by Simply Wall St is general in nature. We provide commentary based on historical data and analyst forecasts only using an unbiased methodology and our articles are not intended to be financial advice. It does not constitute a recommendation to buy or sell any stock, and does not take account of your objectives, or your financial situation. We aim to bring you long-term focused analysis driven by fundamental data. Note that our analysis may not factor in the latest price-sensitive company announcements or qualitative material. Simply Wall St has no position in any stocks mentioned.
Have feedback on this article? Concerned about the content? Get in touch with us directly. Alternatively, email editorial-team@simplywallst.com