
Is Sands China (SEHK:1928) A Bargain Following Its Amap Robot Guide Rollout?
Sands China (SEHK:1928) is back in the spotlight after partnering with Alibaba's Amap to roll out Tutu robot dogs as robotic guides and launch app-based indoor navigation across Sands Resorts Macau.
That AI push comes at an awkward time for the ticker. Sands China’s share price is at HK$11.49 after a modest 1-day gain of 1.68%. However, the 30-day share price return is down 6.13% and the year-to-date share price return has fallen 42.49%, mirroring a 1-year total shareholder return decline of 31.66% that points to fading momentum despite occasional short bursts of interest around product news.
Scan how Sands China’s AI-guided resort move compares with other potential ideas by reviewing a curated list of 55 AI infrastructure stocks in one place.
Bulls argue Sands China’s AI push and analyst target discount hint at mispricing. Bears see a long slide and weak recent returns instead. Which side do the current valuation markers actually line up with?
Preferred P/E of 13.4x for Sands China: Is it justified?
On recent numbers, Sands China trades on a P/E of 13.4x while the last close sits at HK$11.49. That valuation lines up more with a premium story than a distressed one when set beside peers.
The P/E multiple links the current share price to the earnings that Sands China generates for each share. For casino and resort operators, many investors watch this measure closely because it anchors expectations about how durable profits might be through the cycle and how much they are willing to pay for each dollar of earnings.
For this stock, the picture is a bit mixed. Forecast earnings growth of 14.31% per year and high quality earnings support the idea that the market is paying up for a cleaner profit profile. At the same time, earnings declined 3.9% over the past year and profit margins moved from 13.1% to 11.3%, so the current multiple leans on expectations rather than recent profit trends.
The peer context tilts the debate. Sands China trades at 13.4x earnings compared with 13.1x for the Hong Kong Hospitality industry and 8.8x for its direct peer group, which suggests the stock is valued more richly than many comparables. The estimated fair P/E of 13.2x also sits below the current reading, which points to limited room for the ratio to stretch further without new support from earnings.
Explore the SWS fair ratio for Sands China.
Result: Price-to-earnings of 13.4x (OVERVALUED)
Still, weak one-year and multi-year returns, together with profit margins that recently moved lower, could limit how much Sands China can re-rate.
Find out about the key risks to this Sands China narrative.
Another view on Sands China’s value
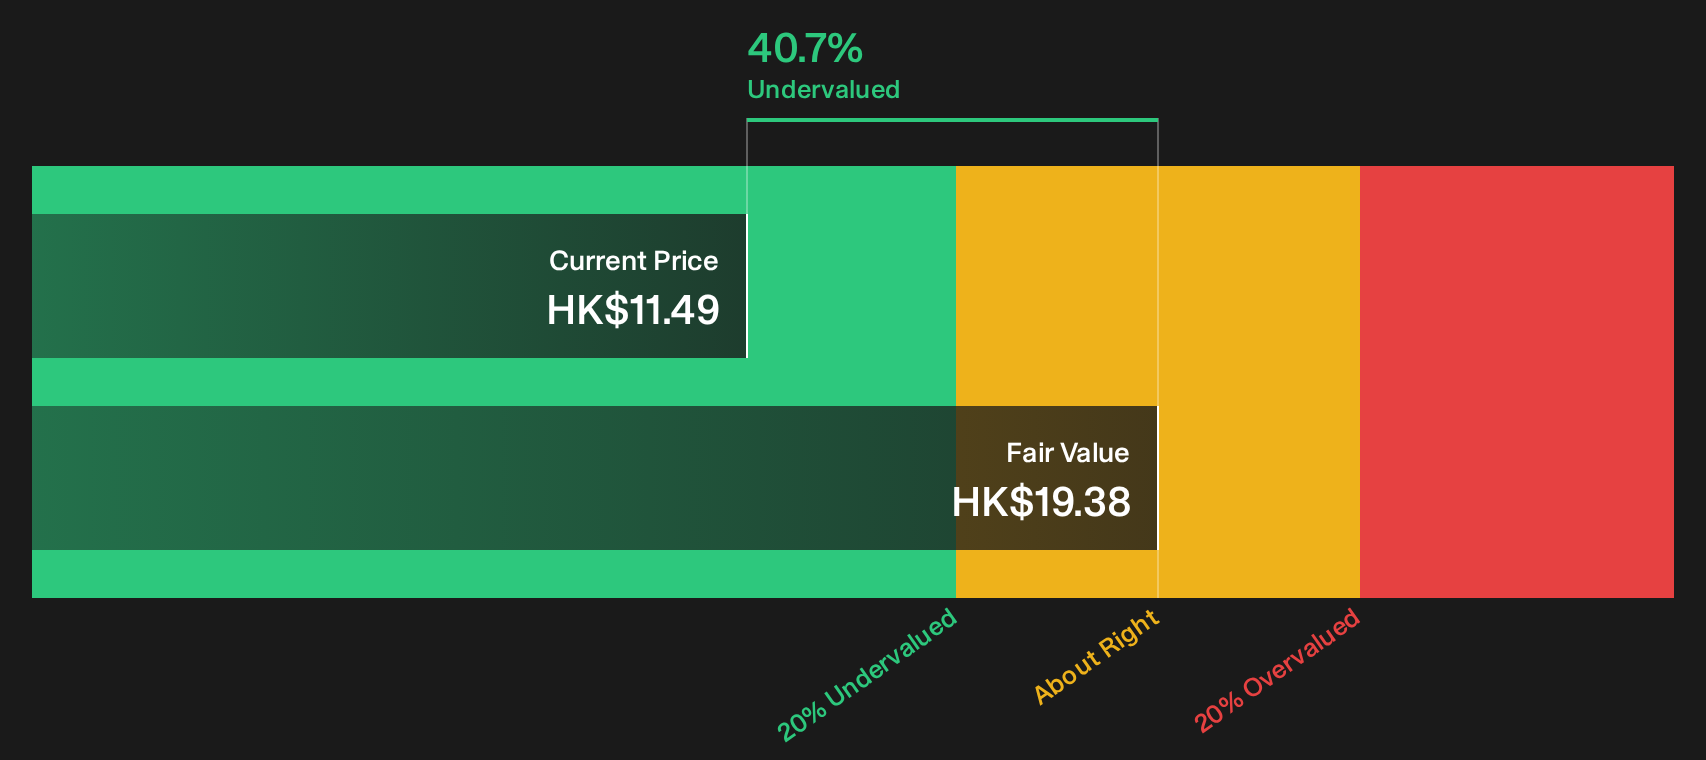
The earnings multiple suggests Sands China looks expensive. The SWS DCF model tells a different story. At HK$11.49, the stock trades roughly 40.7% below an estimated future cash flow value of HK$19.38. This frames recent weakness as a potential mispricing. Which lens do you rely on when cash flows and earnings point in different directions?
Look into how the SWS DCF model arrives at its fair value.
Simply Wall St performs a discounted cash flow (DCF) on every stock in the world every day (check out Sands China for example). We show the entire calculation in full. You can track the result in your watchlist or portfolio and be alerted when this changes, or use our stock screener to discover 196 high quality undervalued stocks. If you save a screener we even alert you when new companies match - so you never miss a potential opportunity.
Next Steps
Mixed messages on Sands China’s value story. If you want to move fast and form your own judgement, weigh both sides by checking the 2 key rewards and 2 important warning signs
Looking for more investment ideas beyond Sands China?
Do not stop with Sands China. Use fresh watchlists from the Simply Wall Street Screener to pressure test your thinking and spot opportunities you might otherwise overlook.
- Target potential mispricings by scanning a focused set of 196 high quality undervalued stocks that combine beaten down prices with stronger underlying fundamentals.
- Prioritise resilience by using a curated 231 resilient stocks with low risk scores to find businesses that score well on balance sheet strength and overall risk profile.
- Hunt for future standouts by reviewing a concentrated pool of 613 high quality undiscovered gems that the broader market may not be watching closely yet.
This article by Simply Wall St is general in nature. We provide commentary based on historical data and analyst forecasts only using an unbiased methodology and our articles are not intended to be financial advice. It does not constitute a recommendation to buy or sell any stock, and does not take account of your objectives, or your financial situation. We aim to bring you long-term focused analysis driven by fundamental data. Note that our analysis may not factor in the latest price-sensitive company announcements or qualitative material. Simply Wall St has no position in any stocks mentioned.
Have feedback on this article? Concerned about the content? Get in touch with us directly. Alternatively, email editorial-team@simplywallst.com