
Is Portfolio Expansion Altering The Investment Case For Harrow Stock (HROW)?
- Harrow's current valuation is being weighed against its sales base, with a P/S ratio below the broader pharmaceuticals group, while the branded ophthalmic portfolio and recent acquisitions expand its addressable market and operating scale.
- The combination of a discounted sales multiple and a growing mix of branded eye-care therapies indicates that investors are reassessing how much of Harrow's commercial platform is already reflected in the price.
- We will now look at how Harrow's low price to sales multiple and expanding eye portfolio interact with its existing investment narrative.
Harrow Investment Narrative Recap
To own Harrow, you need to be comfortable with a focused bet on specialty eye care. The thesis hinges on its branded portfolio driving enough prescription volume and pricing power to support a larger commercial platform. The immediate swing factor is execution in flagship products like VEVYE, IHEEZO, and TRIESENCE, which anchor both the story and the near-term revenue mix.
The biggest operational risk right now sits on the same axis. Heavy dependence on a small group of therapies, combined with an unprofitable bottom line and relatively high CEO pay, raises the bar for delivery. The new information around a low P/S multiple does not change these near-term fundamentals in a material way.
Harrow recently highlighted its branded segment and acquisitions as key parts of its expanding ophthalmic portfolio, which now includes assets such as VEVYE, BYQLOVI, BYOOVIZ, OPUVIZ, and TRIESENCE. That broader reach across dry eye, surgical care, and retinal disease gives the commercial field force more to work with and can make each sales call more productive if integration is tight.
For catalysts, investors are watching how efficiently Harrow can plug these therapies into its existing infrastructure and patient access programs. The same acquisitions that expand reach also raise execution and integration risk, including higher SG&A and potential delays in market uptake. The share price discount to analyst targets adds attention, but the real test remains whether this enlarged portfolio converts into sustainable, higher-quality revenue over the next few years.
What The Harrow Forecasts Actually Assume
Harrow's narrative projects US$784.8 million of revenue and US$246.0 million of earnings by 2029. That path builds in 42.9% yearly revenue growth and an earnings swing of about US$261.0 million from current earnings of a US$15.0 million loss.
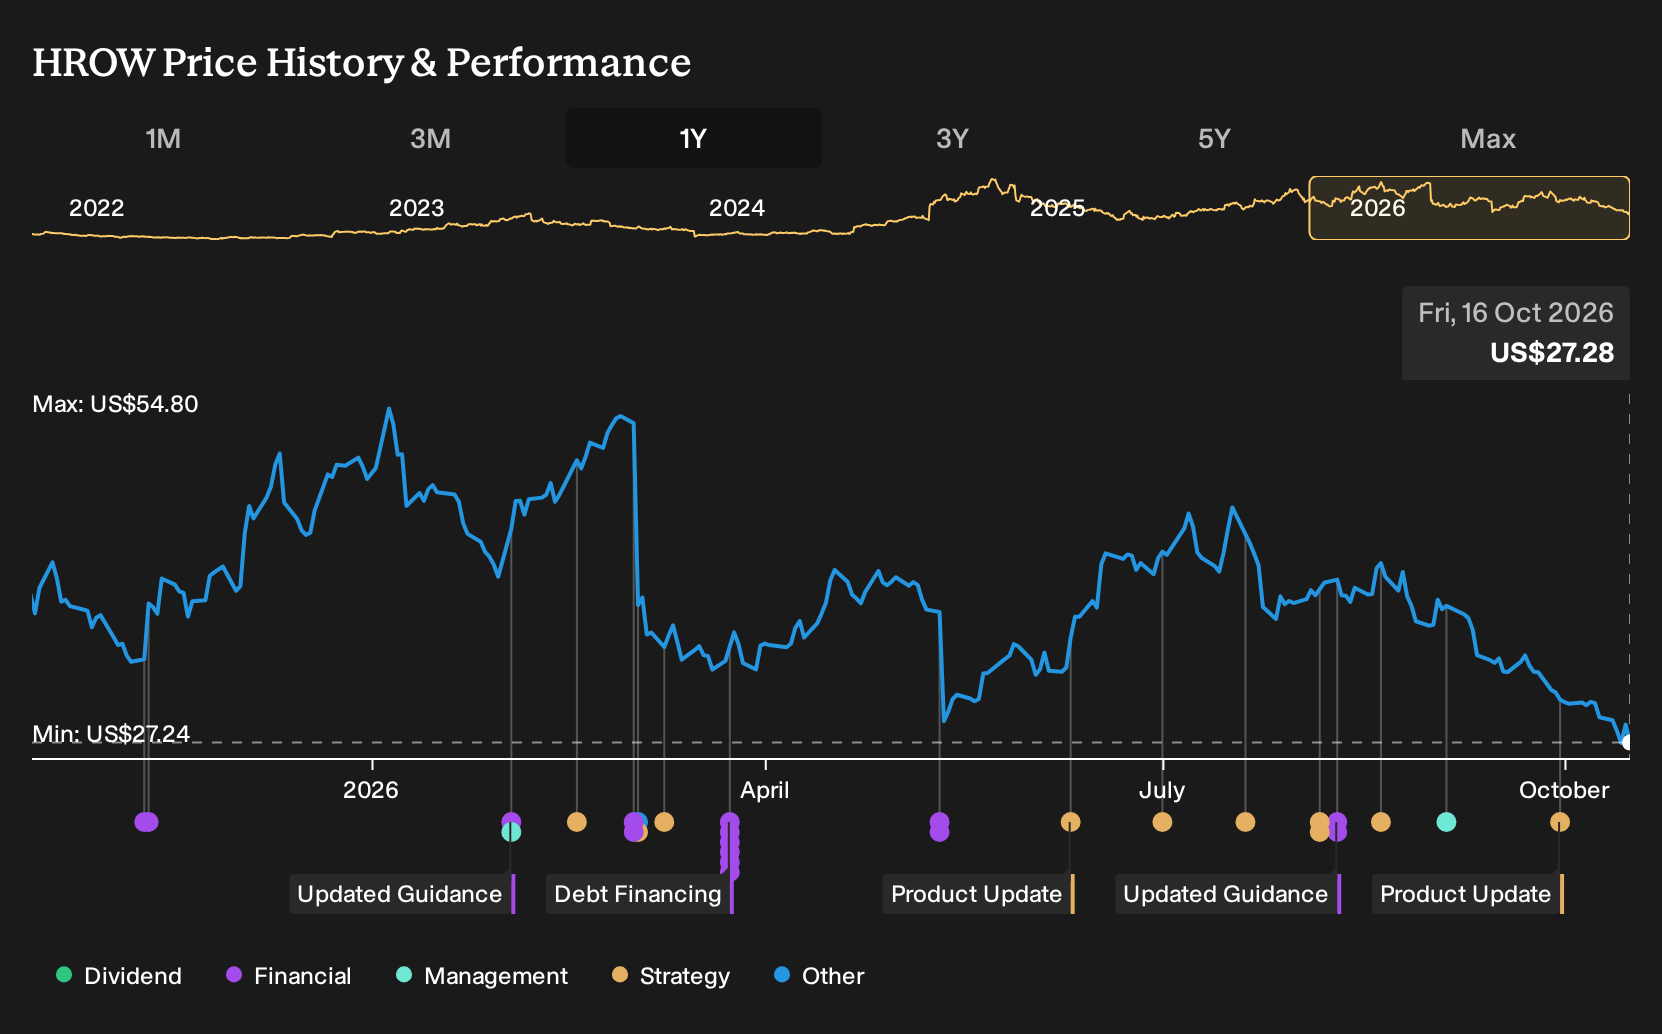
Uncover why Harrow's fair value indicates a 151% potential upside to its current price, which could close far sooner than the forecasts suggest.
Exploring Other Perspectives
The biggest alternate swing factor is pricing pressure. While the consensus still bakes in Harrow reaching about US$784.8 million of revenue and US$246.0 million of earnings by 2029, the most cautious analysts were closer to US$773.9 million and US$148.7 million. That gap shows how sharply views might shift once this valuation news is fully reflected in market expectations.
Explore 2 other Harrow fair value estimates, including one that suggests it could be worth just $45.00!
Reach Your Own Conclusion
Don’t just follow the ticker; dig into the data and build a conviction that’s truly your own.
- A great starting point for your Harrow research is our analysis highlighting 3 key rewards that could impact your investment decision.
- See our latest analysis for Harrow. The report includes a comprehensive fundamental analysis summarized in a single visual, the Snowflake, making it easy to evaluate Harrow’s overall financial health at a glance.
Looking for more investment ideas beyond Harrow?
If Harrow's setup has you thinking about where else a valuation gap might exist, it can help to widen the lens and scan for other companies that fit specific risk and quality profiles.
- For investors who want income to feel sturdier, the 8 dividend fortresses can highlight businesses where yield and balance sheet resilience sit side by side.
- If capital preservation comes first for you, use the 32 resilient stocks with low risk scores to filter for companies that our models flag with more resilient risk profiles.
- When you are hunting for quality that is not yet widely followed, the 20 high quality undiscovered gems can surface under-the-radar opportunities with stronger fundamentals.
This article by Simply Wall St is general in nature. We provide commentary based on historical data and analyst forecasts only using an unbiased methodology and our articles are not intended to be financial advice. It does not constitute a recommendation to buy or sell any stock, and does not take account of your objectives, or your financial situation. We aim to bring you long-term focused analysis driven by fundamental data. Note that our analysis may not factor in the latest price-sensitive company announcements or qualitative material. Simply Wall St has no position in any stocks mentioned.
Have feedback on this article? Concerned about the content? Get in touch with us directly. Alternatively, email editorial-team@simplywallst.com