
How Contracted Cash Flows Will Impact SBM Offshore (ENXTAM:SBMO) Investors
- Recent commentary on SBM Offshore points to solid cash flow visibility from long-term offshore production contracts, which are capital intensive but supported by sizeable, contracted inflows.
- An interesting angle is that discounted future cash flows appear to support the current valuation, which has sharpened focus on how much of SBM Offshore's contract-backed income is already reflected in expectations.
- We will now look at how SBM Offshore's investment narrative is influenced by this perceived cash flow support for the current valuation.
SBM Offshore Investment Narrative Recap
To own SBM Offshore, you need to be comfortable with a business built on capital heavy FPSO projects that convert into long duration lease and operate cash flows. The key belief is that this contract backlog and earnings profile can stay resilient, even if new turnkey work comes in lumpy and day to day sentiment around oil investment cools off.
Right now, the main near term swing factor is execution and uptime on a handful of large FPSOs in Brazil and Guyana or Suriname, because that is where much of the contracted income sits. The biggest risk is project delay or contract change with these large clients. The recent news around cash flow support for the current valuation does not materially change that operational equation.
With no fresh company announcements on the tape, the most relevant reference point is still the size and quality of SBM Offshore's order book. Management reports a strong backlog supported by take or pay contracts from premium counterparties and a mix of lease and operate plus turnkey activity across deepwater production hubs.
For you as a shareholder, that backlog is what ties directly into the discounted cash flow discussion and the idea that current pricing may already embed conservative assumptions. The same book of contracts also concentrates risk. Any slowdown in renewals, tougher pricing from regional FPSO rivals in Brazil, or FX swings between dollar revenues and a euro share price would feed straight into those cash flow based valuation arguments.
SBM Offshore Forecasts And What They Imply
Analysts looking at SBM Offshore are effectively sketching out a future where the business leans on modest top line expansion while accepting thinner profitability. The current consensus assumes revenue grows by 3.6% a year over the next three years and that earnings step down from $925.0 million today to $729.9 million by 2029. That shift means an earnings decline of about $195 million even though the contracted project book supports ongoing activity and lease income.
SBM Offshore's narrative projects $6.5 billion revenue and $729.9 million earnings by 2029. This requires 3.6% yearly revenue growth and an earnings decline of about $195 million from $925.0 million today.
Those same forecasts sit inside a valuation framework that hinges on the 2029 snapshot. On the revenue line, analysts are working with the $6.5b figure for that year and pairing it with the $729.9 million earnings estimate to gauge what the equity might be worth. The fair value story described in recent research effectively says that for this path to make sense, investors would need to be comfortable with SBM Offshore trading on a P/E of 14.1x those projected earnings, compared with 7.6x today and 7.4x for the wider GB energy services peer group.
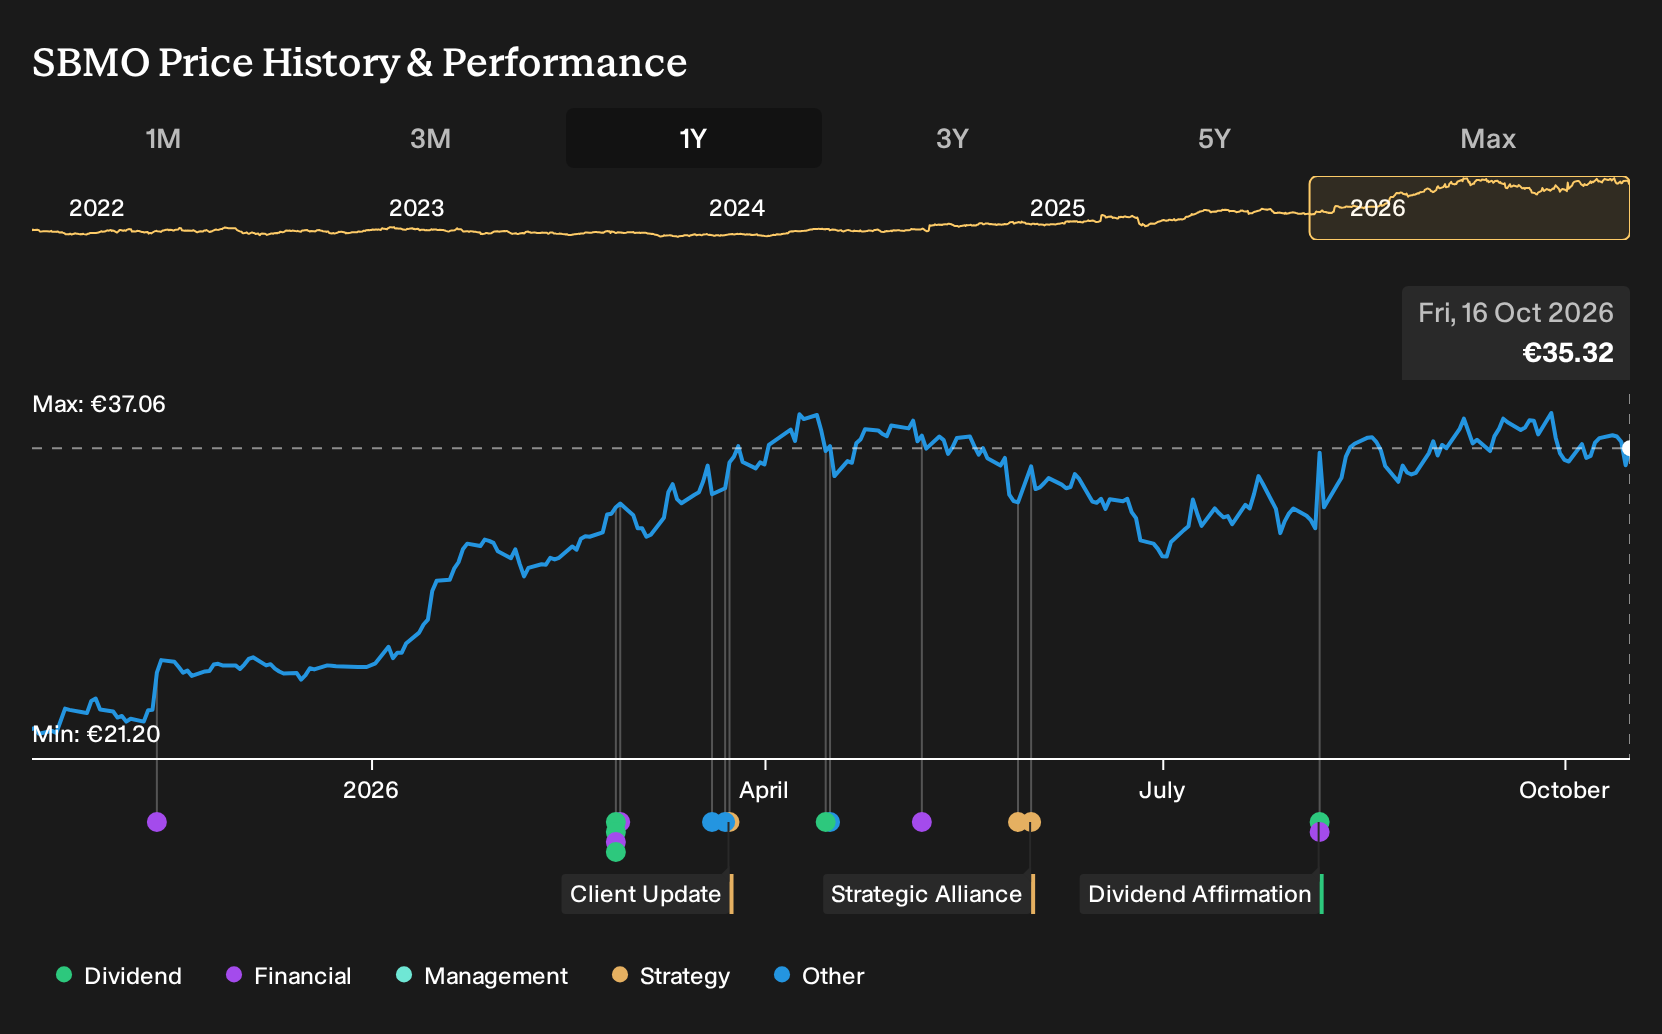
For anyone already holding shares, the gap between the recent €37.06 market price and the €45.04 consensus target, which is 17.7% higher, is only one piece of the puzzle. The more important question is whether the relatively gentle revenue growth, lower margin profile and earnings step down to that $729.9 million level by 2029 line up with personal expectations about FPSO demand, contract renewals and project risk. If personal assumptions differ meaningfully from these inputs, then the implied valuation outcome for SBM Offshore will also look very different.
Uncover why SBM Offshore's fair value indicates a 28% potential upside to its current price, which could narrow quickly.
Exploring Other Perspectives
One bullish twist on SBM Offshore focuses on backlog conversion as a catalyst. The most optimistic analysts were already pencilling in about $7.4b of revenue and $847.5 million of earnings by 2029 before this cash flow news. That is a much richer story than consensus, and it may shift again once fresh views come through.
Explore 4 other SBM Offshore fair value estimates, including one that suggests as much as 59% upside from the current price.
Form Your Own Verdict
Don't just follow the ticker; dig into the data and build a conviction that's truly your own.
- A great starting point for your SBM Offshore research is our analysis highlighting 4 key rewards and 4 important warning signs that could impact your investment decision.
- See our latest analysis for SBM Offshore. The report includes a comprehensive fundamental analysis summarized in a single visual, the Snowflake, making it easy to evaluate SBM Offshore's overall financial health at a glance.
Looking for more investment ideas beyond SBM Offshore?
If SBM Offshore has sharpened your focus on contract visibility and cash flow quality, it can be useful to line it up against other opportunities with different strengths and risk profiles using the Simply Wall St Screener.
- If you want potential value combined with strong fundamentals, start with a curated group of companies screened for quality and pricing through 194 high quality undervalued stocks.
- If capital preservation matters just as much as upside, focus on businesses screened for resilient balance sheets and robust financial footing using the list of solid balance sheet and fundamentals (203 results).
- If you are hunting for under the radar ideas, widen the opportunity set by reviewing a hand picked pool of financially sound outliers via 613 high quality undiscovered gems.
This article by Simply Wall St is general in nature. We provide commentary based on historical data and analyst forecasts only using an unbiased methodology and our articles are not intended to be financial advice. It does not constitute a recommendation to buy or sell any stock, and does not take account of your objectives, or your financial situation. We aim to bring you long-term focused analysis driven by fundamental data. Note that our analysis may not factor in the latest price-sensitive company announcements or qualitative material. Simply Wall St has no position in any stocks mentioned.
Have feedback on this article? Concerned about the content? Get in touch with us directly. Alternatively, email editorial-team@simplywallst.com