
ES Futures Slip Back Into Consolidation: Can 7705 Hold Before the Fed and Midterms?
Between Hot CPI and Hormuz Headlines: What Is Steering ES Right Now
ES futures finished the week on the back foot as a tech led selloff overshadowed improving breadth. As of Friday, October 16, the S&P 500 closed at 7,659.44 (down 1.1%) and the Nasdaq Composite fell 2.1%, with both posting their worst week since June. The S&P tech sector dropped more than 3%, and the PHLX Semiconductor Index had fallen seven straight sessions through Thursday as AI financing fears intensified. CoreWeave became the focal point. As of Thursday, October 15, yields on its 2031 bonds topped 15% and its five-year credit default swap spread widened above 1,000 basis points, a level generally viewed as distressed. Cheaper Chinese memory chip competition added to the pressure.
Rates are the next sensitivity. September CPI, released October 14, rose 0.6% on the month and 3.7% from a year ago, above the 3.6% expected, led by a 9.1% jump in gasoline, while core CPI rose 0.3% (2.6% annually). After the Fed lifted its policy rate to 3.75% to 4.00% in September, its first hike in three years, odds of another hike at the October 27 to 28 meeting stood at 17% on CME FedWatch as of Friday morning, down from about 45% on Wednesday. Odds of a hike by year end were above 90%. The 10-year yield swung from near 5.33% to about 5.05% during the week and sat near 5.1% on Friday.
Geopolitics is feeding both inflation and volatility. As of Friday, Brent touched $110 as Iran escalated attacks in the Strait of Hormuz, with at least nine commercial ships hit since Sunday, while Ukraine vowed to keep striking Russian refineries after an energy ceasefire unraveled. WTI traded near $96 early Friday.
Money rotated rather than fled. The Dow (YM) outperformed near 52,000 with a second straight weekly gain, and the S&P 500 Equal Weight Index outpaced the cap weighted S&P 500 on Thursday as health care and consumer staples led.
What Has the Market Done?
- ES has been trending higher in a block step pattern, with value shifting higher with each consolidation block.
- Toward the end of September, the market stepped up bids to the 7705 area, and from there, it was able to make new ATHs.
- Afterward, the market attempted to accept above 7800 (Daily Level 1), the previous ATH area, but it was unable to do so.
- As a result, the market most recently fell back into the range of consolidation block 2.
- Within that range, the 7705 area (Minor Level 1) marks the middle of consolidation block 2, while the 7600 area (Daily Level 2) marks its low.
What to Expect in the Coming Weeks
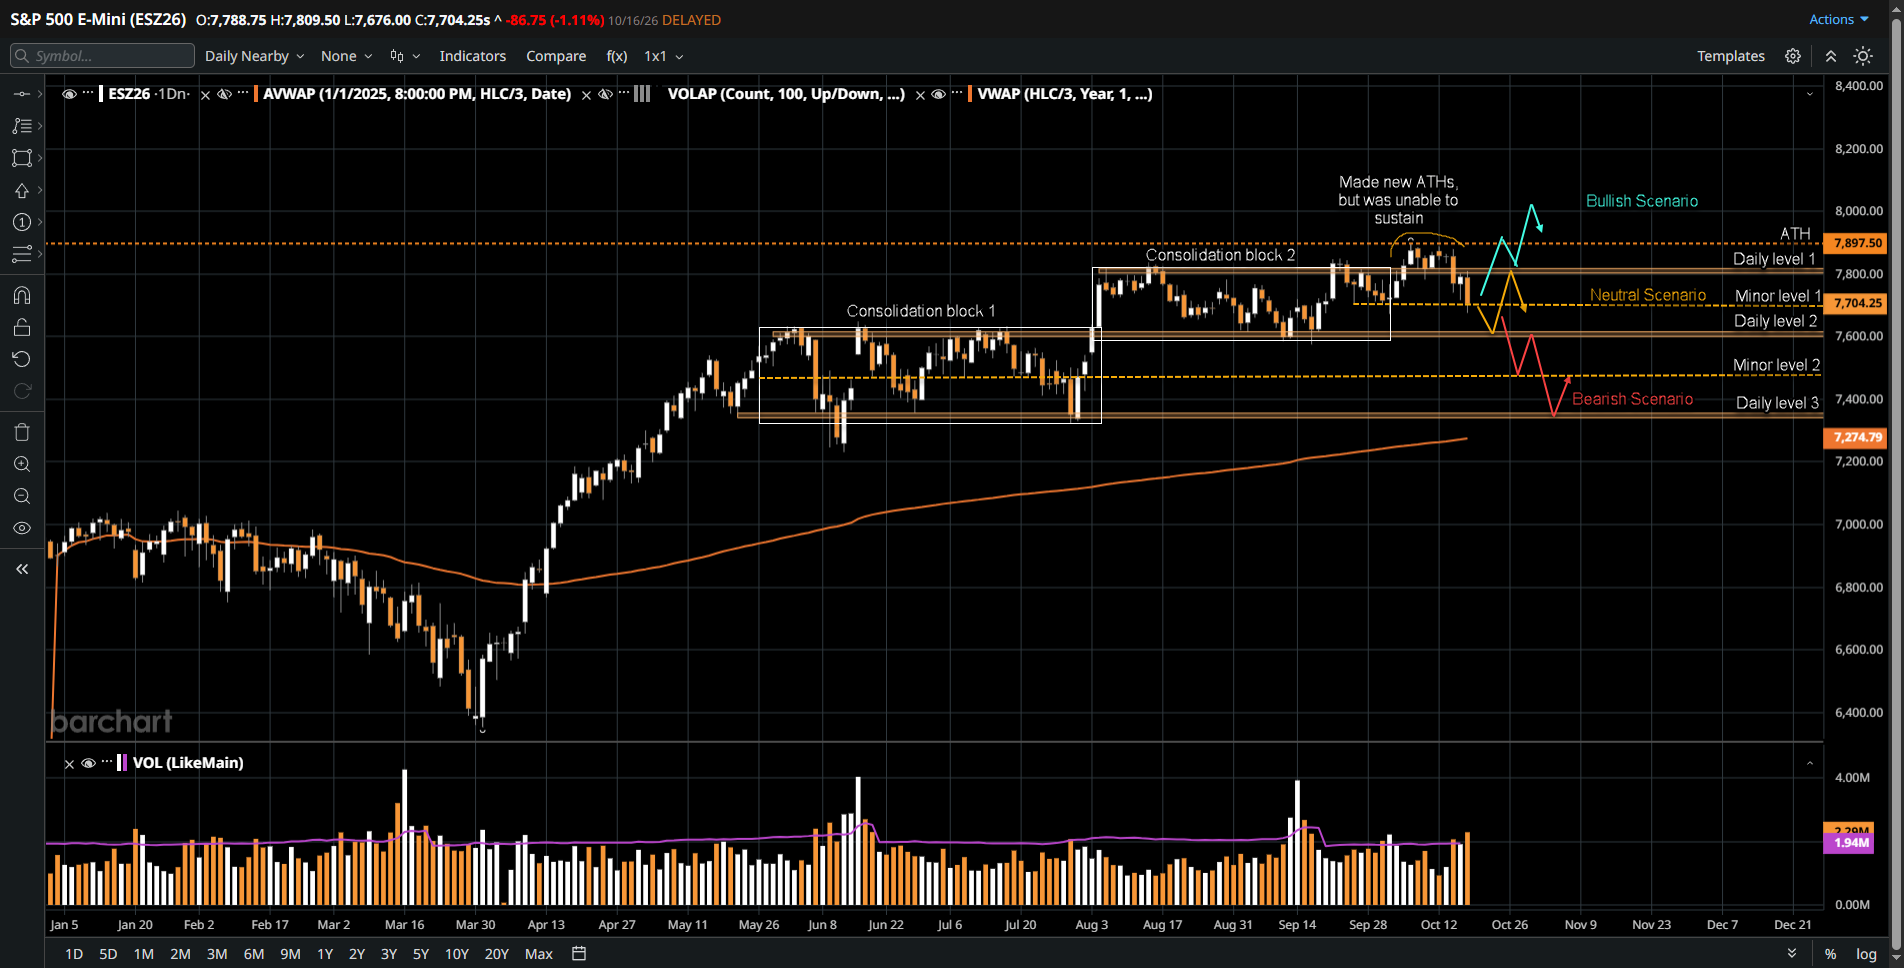
Watch the 7705 area (Minor Level 1) and the 7600 area (Daily Level 2). The scenarios below are framed for the next few weeks to a month.
Bullish Scenario
- If buyers are able to hold bids at the 7705 area (Minor Level 1), a possible outcome is another attempt up to 7897.5 for ATHs.
- If the market is then able to accept above 7800 (Daily Level 1), a further move up to 8000 and beyond for new ATHs becomes possible.
- A possible trigger for this scenario is easing AI credit stress, such as CoreWeave’s bond yields retreating from the 15% area, combined with an October 28 Fed decision that holds rates with measured guidance and calmer Hormuz headlines that pull oil and yields lower.
Neutral Scenario
- If buyers are not able to defend the 7705 area, a move down to 7600 (Daily Level 2) is possible, where buyers may respond.
- In that case, a two-way rotation within consolidation block 2 may follow.
- A possible supporting condition for this scenario is a mixed macro backdrop, such as the Fed holding rates but keeping a year end hike on the table, CoreWeave’s credit stress stabilizing without clearly improving, oil staying elevated near $95 to $100, and next week’s Tesla, Meta and IBM earnings offering no clear direction.
Bearish Scenario
- If buyers are not able to hold bids at 7600, a further move down through consolidation block 1 to 7480 (Minor Level 2), the mid-range of consolidation block 1, is possible.
- If buyers do not respond there, a continued move toward 7360 (Daily Level 3), the low of consolidation block 1, may follow.
- A possible trigger for this scenario is a further widening of AI credit spreads, such as renewed stress in CoreWeave’s bonds and credit default swaps, alongside a Hormuz escalation that sends Brent well above $110, pushes the 10-year yield back toward 5.3% and raises the odds of a Fed hike.
Conclusion
Technically, ES is back inside consolidation block 2, which makes the 7705 area (Minor Level 1) and the 7600 area (Daily Level 2) the key reaction zones, with acceptance above 7800 (Daily Level 1) needed to reopen the path toward ATHs. From a macro view, hot inflation, a 10-year yield near 5.1%, AI credit stress and Hormuz headlines are feeding the same story, and the October 28 Fed decision and October 29 Q3 GDP release arrive just ahead of the November 3 midterm elections. Manage risk carefully around those events. Which level do you think the market will respond to first, 7705 or 7600? Share your view in the comments.
We are the technical partner for traders who understand that edge is built, not bought. EdgeClear provides the execution infrastructure, real-time analytics, and data integrity needed to measure every variable in your trading process. Stop estimating your performance. Open an Account and start quantifying it.
Disclaimer:
This article is provided for informational and educational purposes only and does not constitute financial, investment, or trading advice. The analysis presented reflects the author’s market observations and opinions at the time of writing and is not a recommendation to buy or sell any futures contract, security, or financial instrument. Futures trading involves significant risk and is not suitable for all market participants. Losses may exceed initial margin deposits, and market conditions can change rapidly.
Any scenarios, levels, or market expectations discussed are hypothetical in nature and are intended solely to illustrate potential market behavior. They do not represent actual trading results and should not be interpreted as guarantees of future performance. Past performance, market behavior, or historical price action are not indicative of future outcomes.
Readers are solely responsible for their own trading decisions and risk management. Always conduct independent research, consider your financial situation and risk tolerance, and consult with a qualified financial professional, if necessary, before engaging in futures or derivatives trading.