
American International Group (AIG) Could Be 9% Undervalued As AI Underwriting Story Builds
American International Group (AIG) heads into its upcoming fiscal Q3 2026 earnings release on November 3 with expectations of $1.85 in profit per share, a projected 15.9% decline from last year.
Recent trading has been constructive for American International Group, with the share price at $80.74 after a 2.05% 1-day and 7.18% 30-day share price return. This comes even though the year-to-date share price return is down 4.19%, while the 3-year total shareholder return of 46.35% points to stronger longer term momentum.
Compare how American International Group stacks up against other candidates by scanning our curated list of 33 high quality undervalued stocks that combine quality fundamentals with potential mispricing.
American International Group has a broad insurance franchise and a long history, yet the share price has only just pushed higher after a soft year. Does that recent climb still leave the stock on sale?
Most Popular Narrative: 9% Undervalued
Against the last close at $80.74, the most followed narrative pegs American International Group’s fair value at $88.45, framing today’s price as a discount that hinges on execution in its property and casualty engine.
The acceleration of digitalization and artificial intelligence initiatives such as the Gen AI deployment across underwriting and claims remains central, with tools like Underwriting by AIG Assist and Claims by AIG Assist now allowing American International Group underwriters to process more submissions and quotes faster, which can support better risk selection, lower operating costs and stronger net margins over time.
See why 31 investors see American International Group as 9% undervalued.
Result: Fair Value of $88.45 (UNDERVALUED)
Still, the American International Group narrative can be knocked off course if catastrophe losses stay elevated, or if competition forces weaker pricing and slower premium growth.
Find out about the key risks to this American International Group narrative.
Another View On American International Group’s Valuation
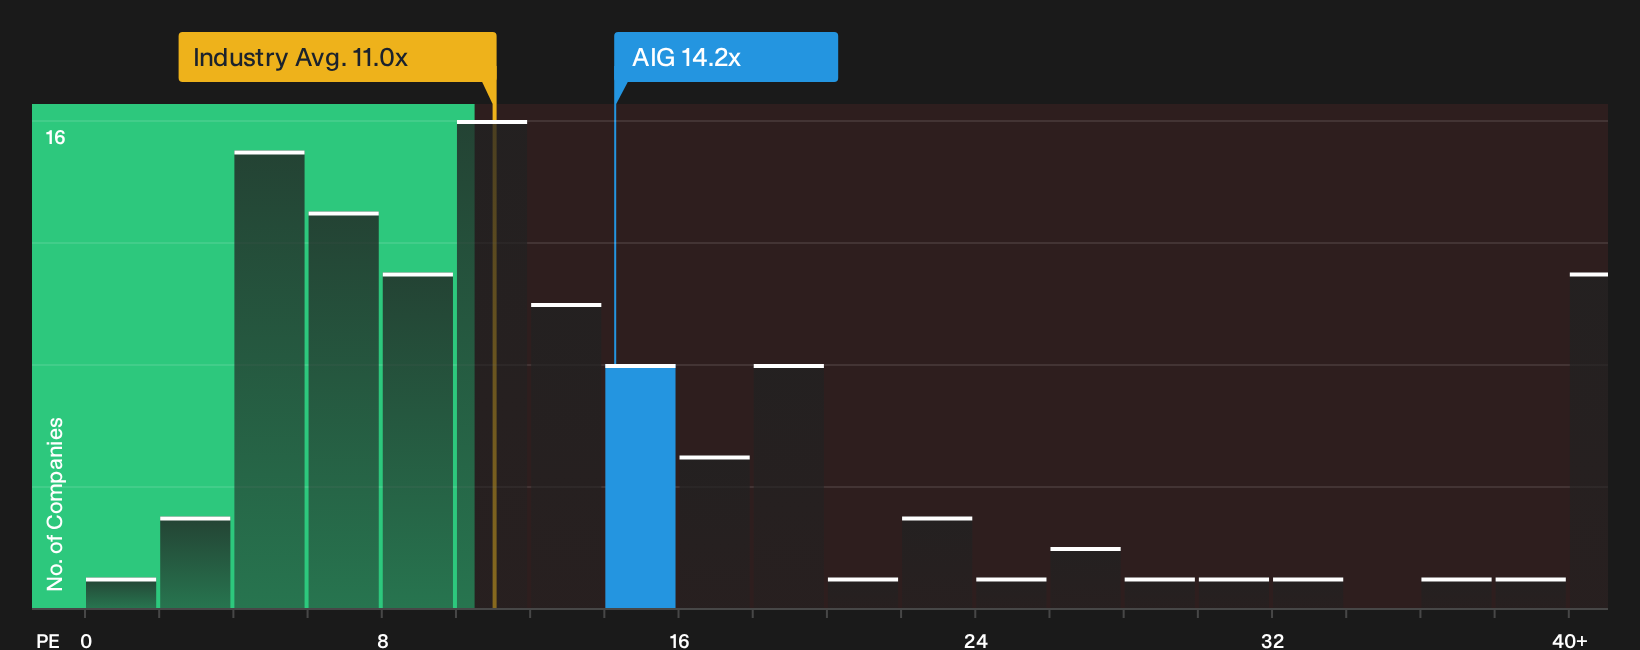
There is a catch. On simple P/E math, American International Group trades around 14.2x earnings, which is richer than both the US Insurance group at roughly 11x and its own fair ratio of 11.8x. That gap points to less of a bargain and more valuation risk if sentiment cools.
For investors who lean on earnings multiples rather than cash flow models, it can be useful to see how this pricing gap fits into a fuller valuation breakdown. This includes where the fair ratio suggests the market could drift over time, before deciding how much risk feels acceptable for a portfolio. See what the numbers say about this price — find out in our valuation breakdown.
Next Steps
Feel bullish on the tone so far, or still on the fence as American International Group heads into earnings? Act quickly and test the upside case against the detailed 3 key rewards
Looking for more investment ideas beyond American International Group?
Do not stop with American International Group. Broaden your watchlist with fresh candidates that match your style so you are not relying on a single thesis.
- Target potential mispricings by scanning a curated mix of quality businesses using the 33 high quality undervalued stocks.
- Prioritize income potential and assess whether payouts look more durable by reviewing the 8 dividend fortresses.
- Dial down volatility risk and focus on resilience by filtering for companies in the 32 resilient stocks with low risk scores.
This article by Simply Wall St is general in nature. We provide commentary based on historical data and analyst forecasts only using an unbiased methodology and our articles are not intended to be financial advice. It does not constitute a recommendation to buy or sell any stock, and does not take account of your objectives, or your financial situation. We aim to bring you long-term focused analysis driven by fundamental data. Note that our analysis may not factor in the latest price-sensitive company announcements or qualitative material. Simply Wall St has no position in any stocks mentioned.
Have feedback on this article? Concerned about the content? Get in touch with us directly. Alternatively, email editorial-team@simplywallst.com