
KYB (TSE:7242) Puts India Expansion In Focus Following Capital Review And Cheap Valuation
KYB (TSE:7242) has put its Indian ambitions on the Board’s table. A scheduled meeting on 8 October 2026 will examine additional capital for subsidiary KIPL and conduct a detailed review of that unit.
Recent price action has been steady rather than explosive, with KYB’s 90-day share price return of 13.35% and a year-to-date share price return of 5.43% sitting behind a much stronger 1-year total shareholder return of 28.01%. This suggests that momentum has been building over a longer horizon as investors reassess growth potential and risk around moves such as the planned India expansion.
Scan other auto and industrial manufacturers showing similar momentum and capital investment stories to KYB by exploring our curated list of list of solid balance sheet and fundamentals (22 results).
KYB looks like a solid industrial story, from established shock absorbers to planned India expansion. The bigger tension for shareholders now is simpler: Does the current share price fairly reflect that strength or stretch it?
Price-to-Earnings of 7.9x: Is it justified?
On simple earnings maths, KYB looks inexpensive. The shares closed at ¥1,585 while the stock trades on a P/E of 7.9x, which appears low compared with both its own fair P/E estimate and the wider auto components peer group.
The P/E ratio compares what investors are paying today with the profits the business is generating. For an established industrial group like KYB with a long operating history, P/E gives a quick sense of how much the market is willing to pay for each unit of current earnings.
In this case, the market is assigning KYB a P/E of 7.9x. That sits below the estimated fair P/E of 8.8x, indicating that investors are pricing the shares more cautiously than the level suggested by the fair ratio. The same 7.9x is also materially lower than both the JP Auto Components industry average of 9.4x and a much higher peer average of 44.5x, which highlights a clear discount on this measure.
Explore the SWS fair ratio for KYB.
Result: Price-to-earnings of 7.9x (UNDERVALUED)
Still, the recent decline in annual net income and the lower growth rate in revenue compared with profit could challenge the upbeat KYB story if those trends persist.
Find out about the key risks to this KYB narrative.
Another view on KYB’s value
Cheap on P/E does not close the debate. KYB is also trading at ¥1,585 while our DCF model estimates future cash flows support a value of ¥1,822.37 per share, suggesting the stock is undervalued on that lens too. If both signals flash “discount,” what could still trip you up?
Look into how the SWS DCF model arrives at its fair value.
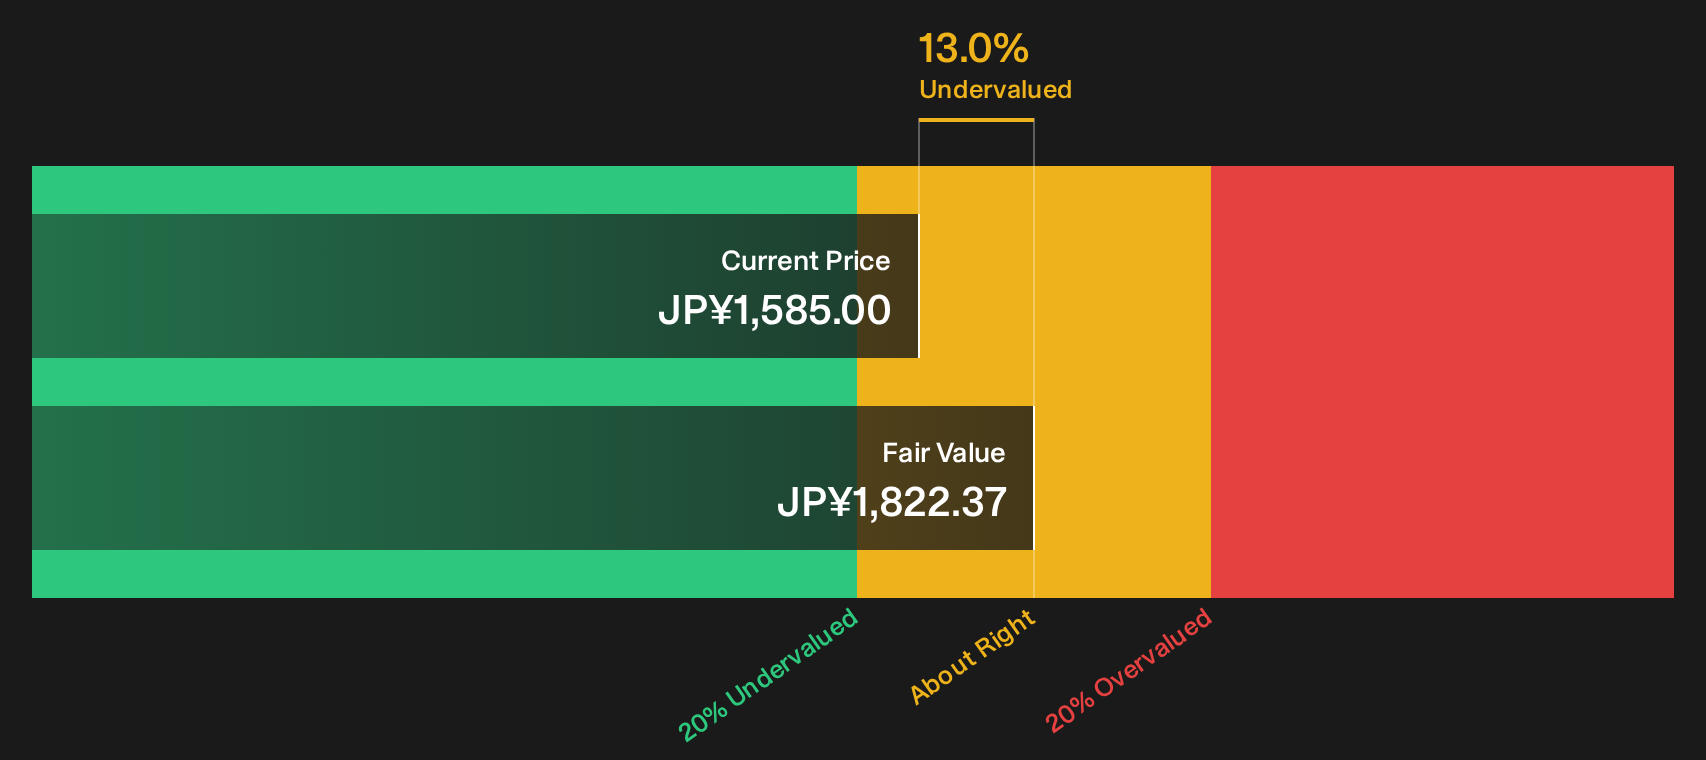
Simply Wall St performs a discounted cash flow (DCF) on every stock in the world every day (check out KYB for example). We show the entire calculation in full. You can track the result in your watchlist or portfolio and be alerted when this changes, or use our stock screener to discover 13 high quality undervalued stocks. If you save a screener we even alert you when new companies match - so you never miss a potential opportunity.
Next Steps
Is this a mixed message or a genuine opportunity for KYB investors? Review the data, consider both the potential concerns and possible upside, then pressure test your own thesis with 2 key rewards and 2 important warning signs.
Looking for more investment ideas beyond KYB?
Do not stop with just one stock. Broaden your watchlist with focused sets of ideas that match how you like to balance opportunity and risk.
- Target potential mispricings by scanning companies that screen as attractively valued using our 13 high quality undervalued stocks.
- Build a steadier income stream by reviewing businesses that meet the criteria in our 29 dividend fortresses.
- Dial down portfolio stress by concentrating on companies with robust finances through our 22 resilient stocks with low risk scores.
This article by Simply Wall St is general in nature. We provide commentary based on historical data and analyst forecasts only using an unbiased methodology and our articles are not intended to be financial advice. It does not constitute a recommendation to buy or sell any stock, and does not take account of your objectives, or your financial situation. We aim to bring you long-term focused analysis driven by fundamental data. Note that our analysis may not factor in the latest price-sensitive company announcements or qualitative material. Simply Wall St has no position in any stocks mentioned.
Have feedback on this article? Concerned about the content? Get in touch with us directly. Alternatively, email editorial-team@simplywallst.com