
Why GuocoLand (SGX:F17) Is Drawing Fresh Attention
Recent commentary on GuocoLand (SGX:F17) focuses on its 59.1% total return over three years and a relatively high P/E ratio. This has prompted fresh questions about whether the current valuation matches underlying earnings power.
Over the past year, GuocoLand’s share price has softened modestly, with a 30 day share price return of 5.7% and a year to date share price return of 1.38%. At the same time, the 1 year total shareholder return of 8.42% and 3 year total shareholder return of 59.13% point to earlier momentum that now appears to be cooling at the current P/E driven valuation.
Compare GuocoLand’s rich P/E and recent returns with those of other real estate players by scanning our curated list of solid balance sheet and fundamentals (203 results) for potential alternatives with sturdier financial footing.
GuocoLand’s strong three year run and softer recent stretch now pull investors in two directions. Is the meaningful upside still ahead, or did most of it already happen at this richer P/E?
Price-to-Earnings of 29.2x: Is it justified?
On simple earnings terms, GuocoLand’s valuation looks heavy. The shares last closed at SGD2.15, which equates to a P/E of 29.2x compared with a peer average of 22.1x and an SG real estate industry average of 12.3x.
The P/E ratio compares what investors pay for each dollar of current earnings. For a property developer such as GuocoLand, a richer multiple usually reflects confidence in future profit resilience, balance sheet strength, or asset quality that is not fully visible in near term reported income.
Here the picture is mixed. Earnings over the past 5 years declined at 22.2% per year, and profits over the past year also fell, with analysts expecting earnings and revenue to keep declining over the next 3 years. Return on equity is low at 1.4%, and even on a forward view the forecast ROE of 1.7% remains subdued. Against that backdrop, a 29.2x P/E looks demanding when set against an estimated fair P/E of 11.6x that our fair ratio suggests the market could revert toward.
The comparison with peers sharpens that point. GuocoLand trades on a P/E that is richer than both its direct peer group at 22.1x and the wider SG real estate sector at 12.3x, which signals that investors are paying a clear premium for each dollar of earnings despite weaker profit trends and low returns.
Explore the SWS fair ratio for GuocoLand.
Result: Price-to-Earnings of 29.2x (OVERVALUED)
Still, the story for GuocoLand can change quickly if the projected earnings decline deepens or if softness in Singapore property activity weighs further on sentiment.
Find out about the key risks to this GuocoLand narrative.
Another View: GuocoLand Through a Cash Flow Lens
The P/E points to GuocoLand looking expensive, yet our DCF model indicates something very different. At SGD2.15, the shares sit about 93.9% below an estimated future cash flow value of SGD35.35. That is a large gap, so which signal should carry more weight for you?
Look into how the SWS DCF model arrives at its fair value.
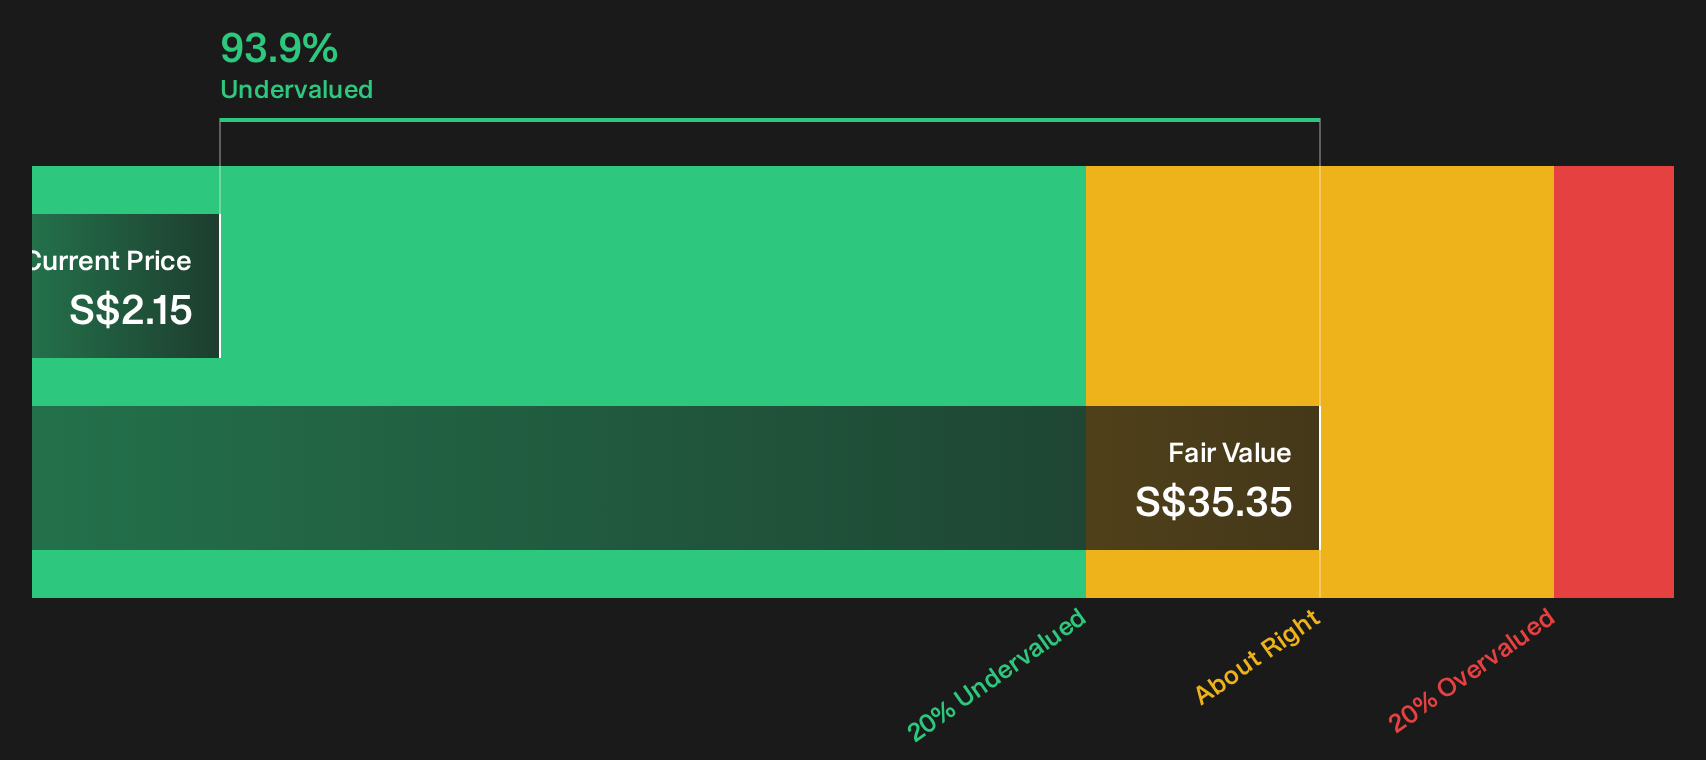
Simply Wall St performs a discounted cash flow (DCF) on every stock in the world every day (check out GuocoLand for example). We show the entire calculation in full. You can track the result in your watchlist or portfolio and be alerted when this changes, or use our stock screener to discover 191 high quality undervalued stocks. If you save a screener we even alert you when new companies match - so you never miss a potential opportunity.
Next Steps
Mixed signals on GuocoLand’s valuation and outlook can feel unclear, so it is important to move quickly and ground your view in the underlying data. To weigh both the potential upside and the areas of concern side by side, review the 1 key reward and 4 important warning signs.
Looking for more investment ideas beyond GuocoLand?
If GuocoLand has you thinking more carefully about price, quality, and risk, you may want to broaden your watchlist with a few targeted stock ideas that fit different goals.
- Target potential mispricing by scanning a focused group of companies that screen as attractively valued through our 191 high quality undervalued stocks.
- Strengthen your income stream by reviewing a hand picked set of higher yielding opportunities in the 214 dividend fortresses.
- Dial down portfolio stress by zeroing in on companies with more robust finances using the 233 resilient stocks with low risk scores.
This article by Simply Wall St is general in nature. We provide commentary based on historical data and analyst forecasts only using an unbiased methodology and our articles are not intended to be financial advice. It does not constitute a recommendation to buy or sell any stock, and does not take account of your objectives, or your financial situation. We aim to bring you long-term focused analysis driven by fundamental data. Note that our analysis may not factor in the latest price-sensitive company announcements or qualitative material. Simply Wall St has no position in any stocks mentioned.
Have feedback on this article? Concerned about the content? Get in touch with us directly. Alternatively, email editorial-team@simplywallst.com