
Tokyo Steel Manufacturing (TSE:5423) Climbed, But What Is Behind Its Latest Move?
Updated profit guidance and what changed
Tokyo Steel Manufacturing (TSE:5423) reset its outlook after revising earnings guidance for the current fiscal year and interim period, lifting profit expectations while trimming some operating targets following asset sales.
Recent trading around Tokyo Steel Manufacturing reflects that earnings revision. The share price is ¥1,688 after a 1-day share price return of 2.74% and a 7-day share price return of 4.78%, while the 30-day share price return is down 4.42%. Over a longer stretch, the stock shows stronger compounding, with a year-to-date share price return of 14.13% and a 1-year total shareholder return of 27.62%, supported by a 5-year total shareholder return of 73.51% that points to meaningful long-term value creation for patient holders.
Scan similar materials stocks that pair improved profit guidance with balance sheet support from asset sales by filtering for list of solid balance sheet and fundamentals (21 results) around Tokyo Steel Manufacturing’s profile today.
Tokyo Steel Manufacturing now trades slightly above both its intrinsic estimate and analyst target after the guidance reset. Is that a cautious ceiling, or a fair reflection of the mixed profit outlook investors just priced in?
Price-to-earnings of 17.7x: Is it justified?
On current numbers, Tokyo Steel Manufacturing trades on a P/E of 17.7x, which leaves the share price at ¥1,688 looking rich compared with several benchmarks.
The P/E ratio compares what investors are paying today for each unit of earnings. For a cyclical steel producer like Tokyo Steel Manufacturing, this yardstick often reflects how confident the market is about the durability of profits through the cycle rather than just the last set of results.
Here, the multiple runs ahead of several anchors. Management has faced declining net income over the past 5 years, with earnings falling 10.4% per year and profit margins compressing from 6% to 3.6%. Analysts also expect earnings to decline by an average of 7.2% per year over the next 3 years and forecast a low 2.8% return on equity, so a premium valuation signals that buyers are willing to look past softer profitability and a weaker earnings outlook.
The comparison with peers is even starker. The stock screens as expensive versus the JP Metals and Mining industry on a P/E of 11.3x and also looks pricey against the peer group average of 12.1x. Relative to an estimated fair P/E of 10.6x, the current 17.7x ratio suggests the market is assigning a much fuller earnings multiple than the level that historical relationships would point toward.
Explore the SWS fair ratio for Tokyo Steel Manufacturing.
Result: Price-to-earnings of 17.7x (OVERVALUED)
Still, softer net income trends and analyst expectations for declining earnings leave limited room for disappointment if Tokyo Steel Manufacturing misses its updated guidance.
Find out about the key risks to this Tokyo Steel Manufacturing narrative.
Another view on Tokyo Steel Manufacturing’s valuation
The P/E ratio paints Tokyo Steel Manufacturing as expensive, yet the SWS DCF model is even harsher. On that approach, the share price of ¥1,688 sits well above an estimated future cash flow value of ¥410.25. If cash flows, not earnings, drive your process, does that change how you see the stock?
Look into how the SWS DCF model arrives at its fair value.
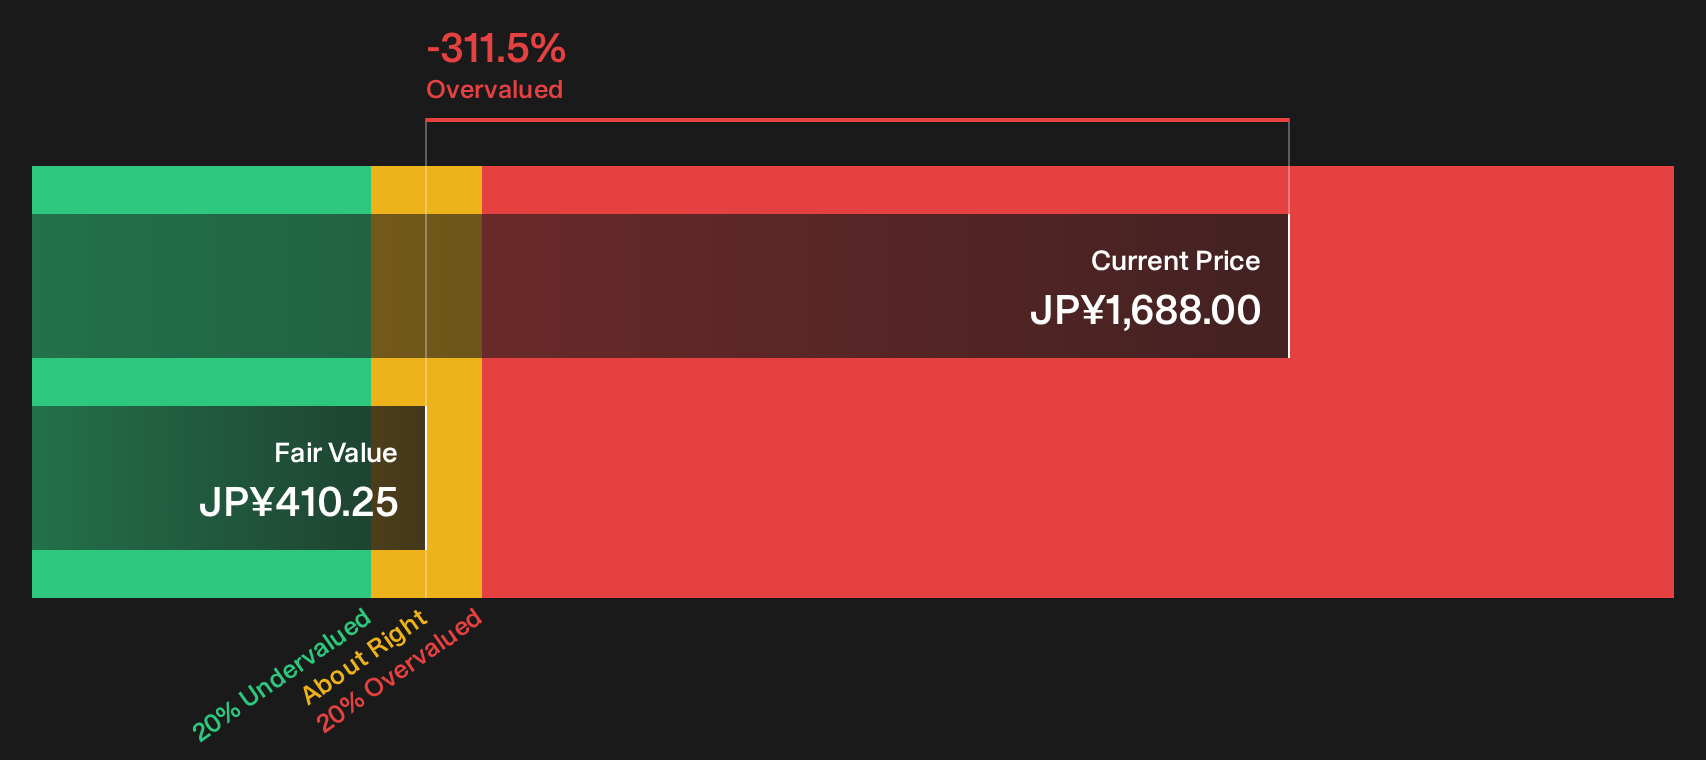
Simply Wall St performs a discounted cash flow (DCF) on every stock in the world every day (check out Tokyo Steel Manufacturing for example). We show the entire calculation in full. You can track the result in your watchlist or portfolio and be alerted when this changes, or use our stock screener to discover 14 high quality undervalued stocks. If you save a screener we even alert you when new companies match - so you never miss a potential opportunity.
Next Steps
Worried the tone around Tokyo Steel Manufacturing feels too cautious or too harsh? Move quickly, test the assumptions against the data, then weigh those 4 important warning signs
Looking for more investment ideas beyond Tokyo Steel Manufacturing?
If Tokyo Steel Manufacturing feels fully priced, do not stop here. Broaden your watchlist now, or you risk missing opportunities hiding in plain sight.
- Hunt for quality at a discount by scanning a curated 14 high quality undervalued stocks set up to surface businesses with solid fundamentals at more modest valuations.
- Target resilient cash generators by reviewing a focused 29 dividend fortresses designed for investors who want income potential backed by sturdier balance sheets.
- Prioritise peace of mind by filtering for a 22 resilient stocks with low risk scores that highlights companies with lower risk scores and more defensible financial profiles.
This article by Simply Wall St is general in nature. We provide commentary based on historical data and analyst forecasts only using an unbiased methodology and our articles are not intended to be financial advice. It does not constitute a recommendation to buy or sell any stock, and does not take account of your objectives, or your financial situation. We aim to bring you long-term focused analysis driven by fundamental data. Note that our analysis may not factor in the latest price-sensitive company announcements or qualitative material. Simply Wall St has no position in any stocks mentioned.
Have feedback on this article? Concerned about the content? Get in touch with us directly. Alternatively, email editorial-team@simplywallst.com