
Winmark (WINA) Added A Special Dividend, Is The Upside Already Priced In?
Winmark (WINA) grabbed investor attention after third quarter results landed alongside a fresh cash return package, pairing a new US$4.00 per share special dividend with its regular quarterly payout.
At a US$314.73 share price, Winmark has seen a sharp 7 day share price return of 7.84% and a 30 day gain of 6.74%. However, momentum has faded over the past quarter, with the 90 day share price return down 18.90% and the year to date share price return down 21.63%. This has contributed to a 1 year total shareholder return that declined 25.48%, even though the 5 year total shareholder return is still up 68.17%.
Compare how Winmark’s dividend move aligns with other cash-generative franchises by running your filters through a curated set of 20 high quality undiscovered gems today.
After that post earnings jump and fresh cash return, the real tension is simple. Is Winmark now priced for what just happened or for what still lies ahead on valuation grounds?
Price-to-Earnings of 27x: Is it justified?
On simple valuation math, Winmark trades on a P/E of 27x, which places the $314.73 share price well above where many peers change hands.
The P/E ratio compares the current share price with earnings per share and helps you see how much investors are paying for each dollar of profit. For a franchise-heavy retailer like Winmark, that multiple effectively reflects what the market is willing to pay for its licensing cash flows and equipment leasing earnings.
The current 27x P/E sits far above the estimated fair P/E of 9.6x, so the market is attaching a much richer tag to Winmark's earnings stream than the fair ratio model suggests. That same 27x level is also well ahead of both the US Specialty Retail industry average of 17.2x and the peer average of 17x, which points to a sizable premium that could narrow if sentiment cools or earnings forecasts continue to indicate a decline of 0.4% per year over the next 3 years.
Explore the SWS fair ratio for Winmark.
Result: Price-to-Earnings of 27x (OVERVALUED)
Still, revenue growth of 36.29% alongside flat net income and a 15.52% decline in 3 year total return raises questions about how resilient Winmark’s premium really is.
Find out about the key risks to this Winmark narrative.
Another View: What The DCF Says About Winmark
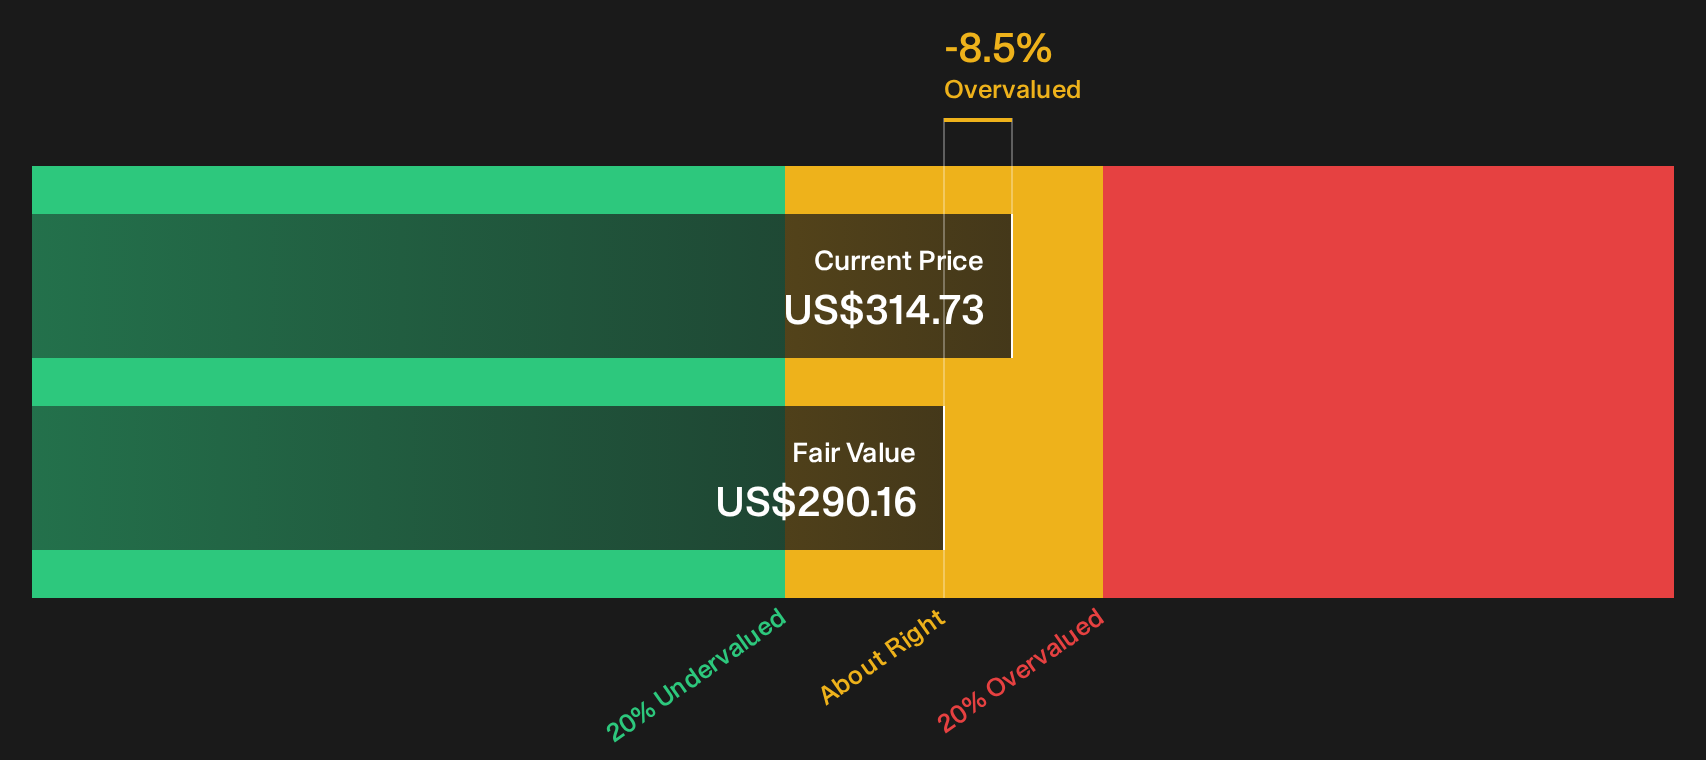
A different lens comes from the SWS DCF model, which puts Winmark's future cash flow value at $290.16 compared with the current $314.73 share price. That points to shares trading above this estimate, so the question is whether investors are paying up for resilience or stretching too far.
Look into how the SWS DCF model arrives at its fair value.
Simply Wall St performs a discounted cash flow (DCF) on every stock in the world every day (check out Winmark for example). We show the entire calculation in full. You can track the result in your watchlist or portfolio and be alerted when this changes, or use our stock screener to discover 33 high quality undervalued stocks. If you save a screener we even alert you when new companies match - so you never miss a potential opportunity.
Next Steps
Mixed signals around Winmark's valuation and cash returns do not have to leave you guessing. Move quickly, review the full numbers, and weigh both the 2 key rewards and 4 important warning signs.
Looking for more Winmark sized investment ideas?
Do not stop your research with Winmark. Broaden your watchlist with a few focused stock sets that could sharpen how you think about price, quality, and risk.
- Target reliable cash flow by scanning companies built around strong payouts and balance sheets through the 8 dividend fortresses.
- Hunt for high quality businesses that trade below their estimated worth by running a tailored screen across the 33 high quality undervalued stocks.
- Dial down portfolio stress and concentrate on durability by filtering for companies in the 32 resilient stocks with low risk scores.
This article by Simply Wall St is general in nature. We provide commentary based on historical data and analyst forecasts only using an unbiased methodology and our articles are not intended to be financial advice. It does not constitute a recommendation to buy or sell any stock, and does not take account of your objectives, or your financial situation. We aim to bring you long-term focused analysis driven by fundamental data. Note that our analysis may not factor in the latest price-sensitive company announcements or qualitative material. Simply Wall St has no position in any stocks mentioned.
Have feedback on this article? Concerned about the content? Get in touch with us directly. Alternatively, email editorial-team@simplywallst.com