
Why Takara Holdings (TSE:2531) Shares Climbed And What Investors Are Watching
Takara Holdings (TSE:2531) is back in focus after Oasis Management disclosed a 5.09% stake and confirmed talks with management on capital allocation, including potential transfers or divestitures of certain operations.
That activist filing lands on a stock that has already been running hard, with Takara Holdings posting a 1 day share price return of 14.34% and a 7 day share price return of 20.99% as investors weigh the impact of capital allocation talks and the recent board approval to transfer 70% of Takara Butsuryu System.
Momentum has been firmly positive for a while, with a 30 day share price return of 27.07% and a 90 day share price return of 45.82%. Longer term investors are looking at a 1 year total shareholder return of 83.73% and a 3 year total shareholder return of 176.71%, as the latest activism adds a fresh angle on risk and potential value.
Capitalize on the renewed interest in Takara Holdings by scanning a curated list of other companies where activists, board decisions, or fresh capital plans could be catalysts through 73 high quality undiscovered gems.After a move like this, the real tension is not the headlines around activism, but where fair value for Takara Holdings actually lines up against the spread in published estimates and the current share price.
Price-to-Earnings of 51.5x: Is it justified?
Takara Holdings last closed at ¥3,133, on a valuation that screens as expensive on earnings, with a P/E of 51.5x compared with both its Asian beverage peers and its own analysts' peer group.
The P/E ratio compares what investors are paying today for each unit of current earnings. For a business that spans alcoholic beverages, seasonings, biotech and logistics, a high multiple usually signals that the market is placing a premium on future profit potential rather than current profitability.
Earnings trends for Takara Holdings do not obviously support a rich valuation. Net profit has fallen by 5.1% per year over the past 5 years, profit margins have narrowed from 4.5% to 3%, and return on equity sits at 2.7%, which is described as low. Against that backdrop, a 51.5x P/E ratio suggests investors are paying a high price relative to recent profit performance.
The comparison with the broader sector is also stark. The P/E of 51.5x is described as expensive against the Asian beverage industry average of 16.4x. This gap points to a much richer valuation than the typical regional peer rather than a small premium for quality or size.
See what the numbers say about this price — find out in our valuation breakdown.
Result: Price-to-Earnings of 51.5x (OVERVALUED)
Still, the story around Takara Holdings can shift quickly if activism talks stall or if any divestitures fail to improve overall profitability and capital efficiency.
Find out about the key risks to this Takara Holdings narrative.
Another View: What The SWS DCF Model Says About Takara Holdings
The P/E ratio paints Takara Holdings as expensive, yet the SWS DCF model goes even further. It estimates future cash flow value at ¥764.3 per share versus a market price of ¥3,133, which points to a stock trading well above that cash flow based value. So which signal do you trust when the market is this enthusiastic?
Look into how the SWS DCF model arrives at its fair value.
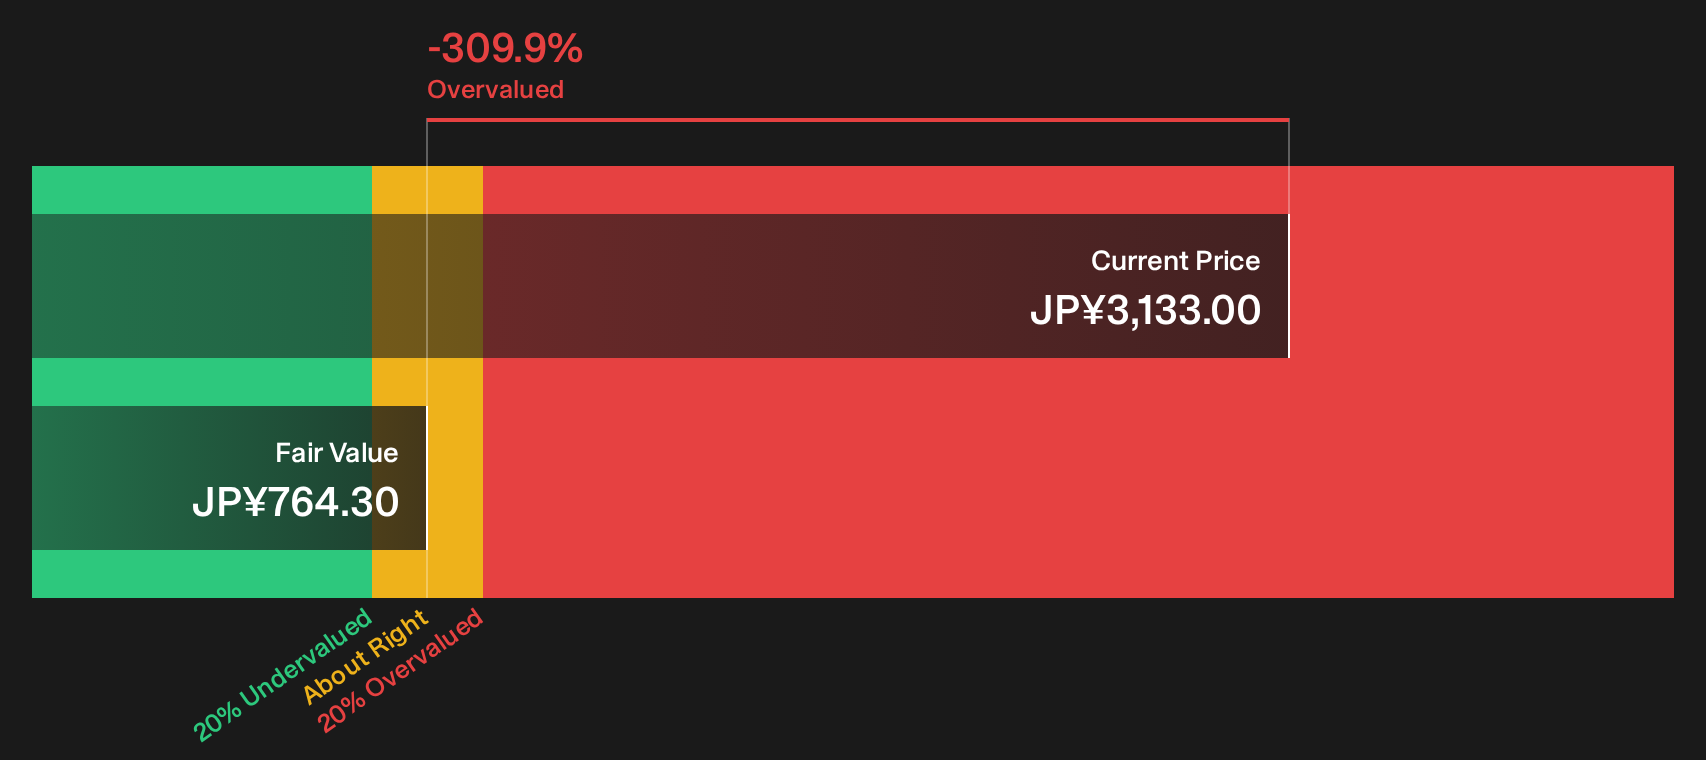
Simply Wall St performs a discounted cash flow (DCF) on every stock in the world every day (check out Takara Holdings for example). We show the entire calculation in full. You can track the result in your watchlist or portfolio and be alerted when this changes, or use our stock screener to discover 14 high quality undervalued stocks. If you save a screener we even alert you when new companies match - so you never miss a potential opportunity.
Next Steps
If you are concerned that this sounds too optimistic or too critical of Takara Holdings and want to understand what the numbers imply for risk, start by examining the 3 important warning signs.
Looking for more Takara Holdings style ideas?
If you are serious about putting this Takara Holdings research to work, do not stop at a single ticker. Use curated screeners to surface other opportunities that match your risk and return preferences while this market is still offering them.
- Target potential mispricings by reviewing companies that screen as high quality and potentially undervalued through the 14 high quality undervalued stocks.
- Prioritize resilience and capital strength by filtering for businesses in the list of solid balance sheet and fundamentals (21 results).
- Hunt for overlooked opportunities with healthier fundamentals before the crowd catches on by scanning the 73 high quality undiscovered gems.
This article by Simply Wall St is general in nature. We provide commentary based on historical data and analyst forecasts only using an unbiased methodology and our articles are not intended to be financial advice. It does not constitute a recommendation to buy or sell any stock, and does not take account of your objectives, or your financial situation. We aim to bring you long-term focused analysis driven by fundamental data. Note that our analysis may not factor in the latest price-sensitive company announcements or qualitative material. Simply Wall St has no position in any stocks mentioned.
Have feedback on this article? Concerned about the content? Get in touch with us directly. Alternatively, email editorial-team@simplywallst.com