
3 Stocks That Might Be Trading At Discounts Of Up To 49.7%
In the last week, the United States market has stayed flat, though it has risen 14% over the past year with earnings forecasted to grow by 17% annually. In this context of steady growth and positive forecasts, identifying stocks that might be trading at discounts can offer potential opportunities for investors seeking value in a promising market environment.
Top 10 Undervalued Stocks Based On Cash Flows In The United States
| Name | Current Price | Fair Value (Est) | Discount (Est) |
| Zions Bancorporation National Association (ZION) | $63.01 | $123.56 | 49% |
| Sociedad Química y Minera de Chile (SQM) | $60.47 | $118.82 | 49.1% |
| Pegasystems (PEGA) | $35.95 | $71.50 | 49.7% |
| KeyCorp (KEY) | $19.94 | $39.51 | 49.5% |
| Insteel Industries (IIIN) | $29.67 | $57.55 | 48.4% |
| EOG Resources (EOG) | $152.62 | $296.04 | 48.4% |
| Civista Bancshares (CIVB) | $26.85 | $53.30 | 49.6% |
| Best Buy (BBY) | $94.17 | $186.82 | 49.6% |
| Artisan Partners Asset Management (APAM) | $32.76 | $65.13 | 49.7% |
| Addus HomeCare (ADUS) | $116.49 | $226.18 | 48.5% |
Below we spotlight a couple of our favorites from our exclusive screener.
Pegasystems (PEGA)
Overview: Pegasystems Inc. is a global company that develops, markets, licenses, hosts, and supports enterprise software solutions across various regions including the Americas, Europe, the Middle East, Africa, and Asia-Pacific with a market cap of approximately $5.56 billion.
Operations: The company's revenue primarily comes from its Software & Programming segment, generating $1.74 billion.
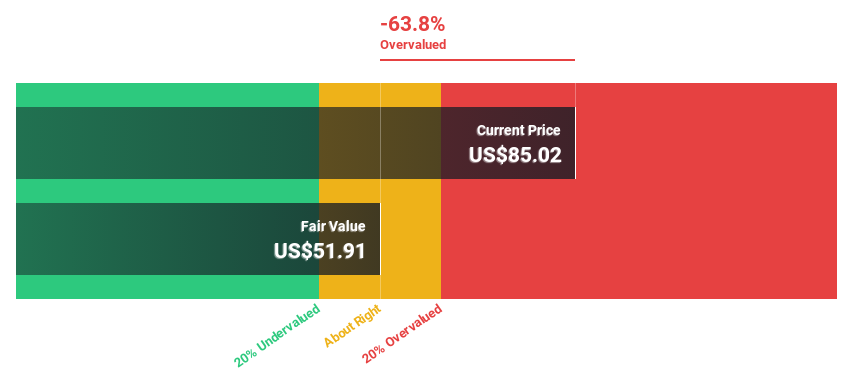
Estimated Discount To Fair Value: 49.7%
Pegasystems is trading at US$35.95, significantly below its estimated future cash flow value of US$71.5, suggesting it may be undervalued based on cash flows. Despite slower forecasted revenue growth compared to the market, Pegasystems shows strong potential with a high forecasted return on equity of 82.7%. Recent strategic developments include expanding partnerships and launching innovative AI products that enhance enterprise application development and customer engagement capabilities, potentially bolstering future cash flow generation.
- According our earnings growth report, there's an indication that Pegasystems might be ready to expand.
- Click here and access our complete balance sheet health report to understand the dynamics of Pegasystems.
Interface (TILE)
Overview: Interface, Inc. designs, produces, and sells modular carpet products across various regions including the United States, Canada, Latin America, Europe, Africa, Asia, and Australia with a market cap of $2.03 billion.
Operations: The company's revenue is derived from two primary segments: $867.84 million from the Americas and $572.81 million from Europe, Africa, Asia, and Australia.
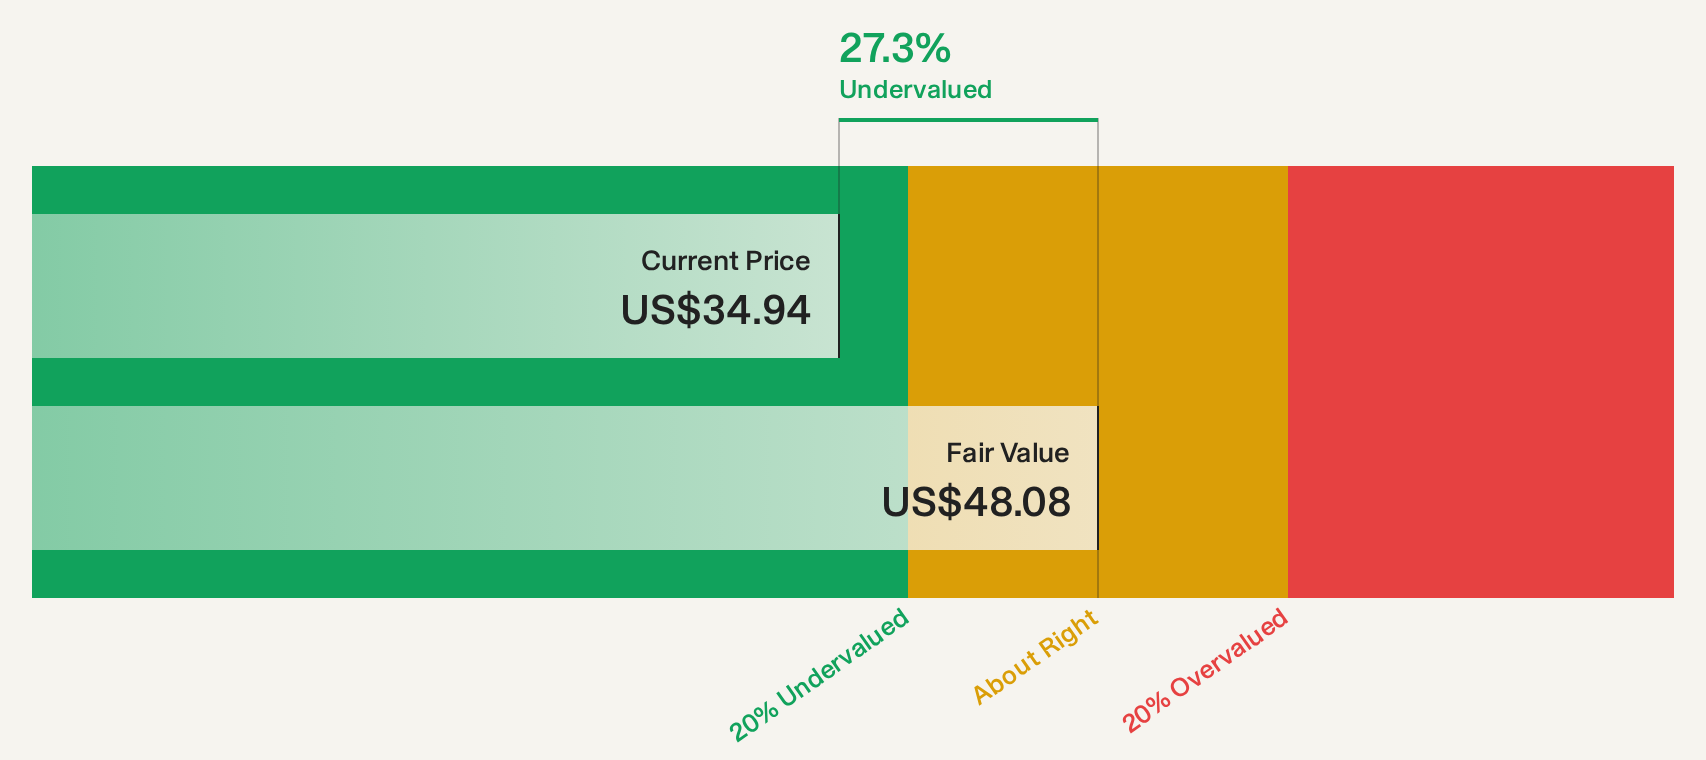
Estimated Discount To Fair Value: 25.2%
Interface is priced at US$35.95, well below its future cash flow value of US$48.08, indicating potential undervaluation based on cash flows. Despite slower projected earnings and revenue growth compared to the broader market, recent product launches like Twist & Texture™ and Between the Notes highlight Interface's commitment to innovation in sustainable flooring solutions. However, significant insider selling over the past quarter could be a concern for investors evaluating long-term prospects.
- In light of our recent growth report, it seems possible that Interface's financial performance will exceed current levels.
- Dive into the specifics of Interface here with our thorough financial health report.
Hayward Holdings (HAYW)
Overview: Hayward Holdings, Inc. designs, manufactures, and markets a portfolio of pool equipment and automation systems globally, with a market cap of approximately $2.44 billion.
Operations: The company generates revenue primarily from North America with $1.03 billion and Europe & Rest of World contributing $163.66 million.
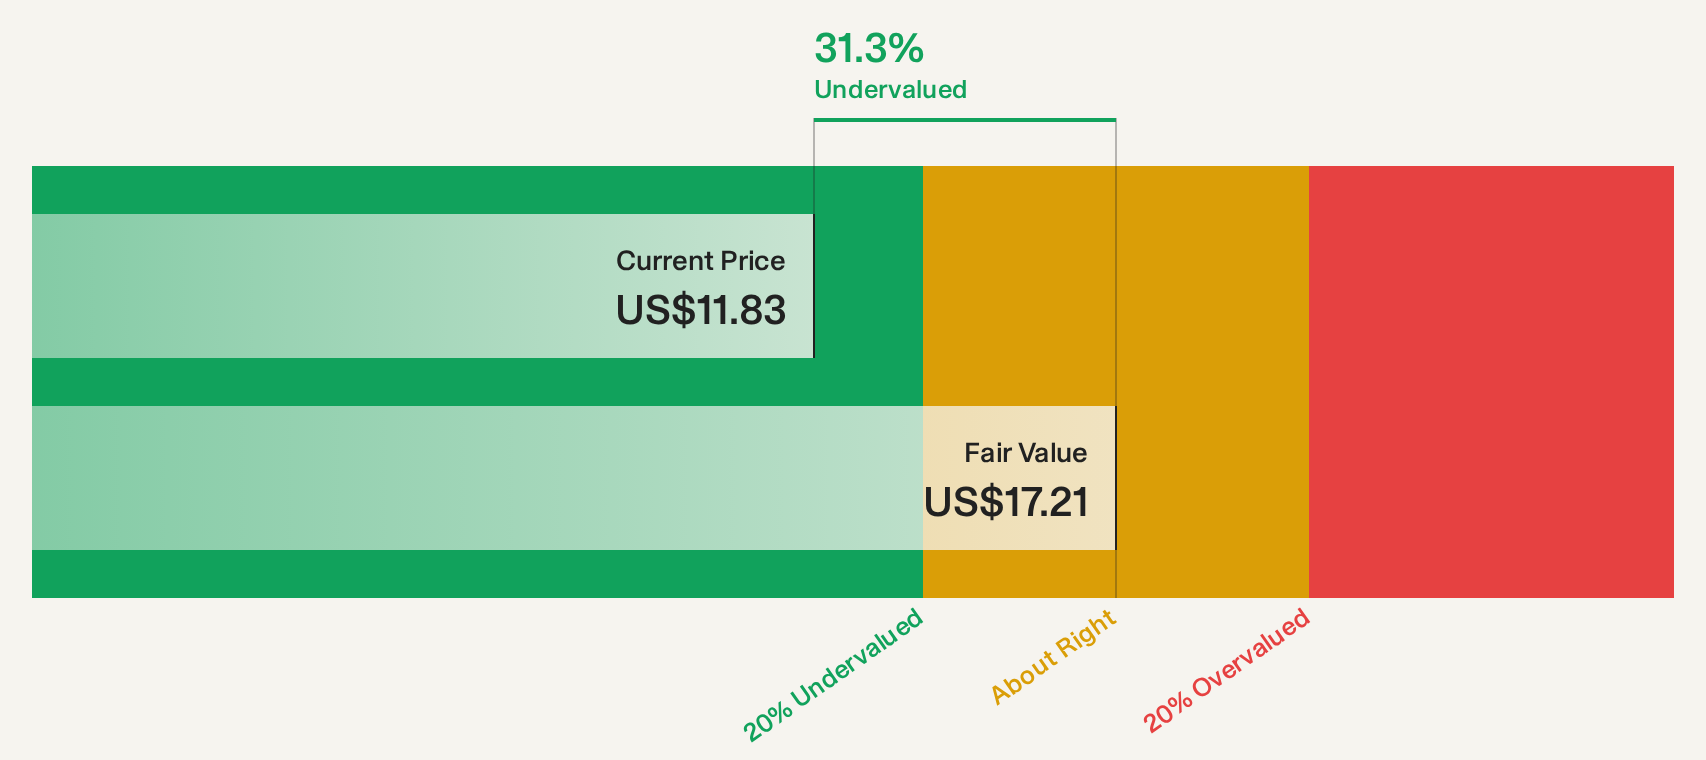
Estimated Discount To Fair Value: 31.3%
Hayward Holdings trades at US$11.74, below its estimated future cash flow value of US$17.09, highlighting potential undervaluation based on cash flows. Despite a forecasted earnings growth of 10.7% annually, which lags behind the broader US market, Hayward's strong operational cash flow and recent share buybacks demonstrate robust financial health and strategic capital management. Leadership changes aim to enhance financial processes further, supporting continued investment and potential acquisitions amidst steady revenue growth expectations.
- Our earnings growth report unveils the potential for significant increases in Hayward Holdings' future results.
- Unlock comprehensive insights into our analysis of Hayward Holdings stock in this financial health report.
Make It Happen
- Investigate our full lineup of 100 Undervalued US Stocks Based On Cash Flows right here.
- Have a stake in these businesses? Integrate your holdings into Simply Wall St's portfolio for notifications and detailed stock reports.
- Elevate your portfolio with Simply Wall St, the ultimate app for investors seeking global market coverage.
Curious About Other Options?
- Explore high-performing small cap companies that haven't yet garnered significant analyst attention.
- Diversify your portfolio with solid dividend payers offering reliable income streams to weather potential market turbulence.
- Fuel your portfolio with companies showing strong growth potential, backed by optimistic outlooks both from analysts and management.
This article by Simply Wall St is general in nature. We provide commentary based on historical data and analyst forecasts only using an unbiased methodology and our articles are not intended to be financial advice. It does not constitute a recommendation to buy or sell any stock, and does not take account of your objectives, or your financial situation. We aim to bring you long-term focused analysis driven by fundamental data. Note that our analysis may not factor in the latest price-sensitive company announcements or qualitative material. Simply Wall St has no position in any stocks mentioned.
Have feedback on this article? Concerned about the content? Get in touch with us directly. Alternatively, email editorial-team@simplywallst.com