
Why CVB Financial (CVBF) Moved And What Investors Are Watching Now
CVB Financial (CVBF) is back in focus as its upcoming quarterly earnings, which are expected to show year over year growth, intersect with questions about deposit costs, loan health, and the impact of the Heritage Commerce integration.
Recent trading tells a mixed story. The 1 day share price return of 2.25% lifted CVB Financial to US$21.83, yet the 30 day share price return is down 4.71% and the 90 day share price return is down 4.34%. At the same time, a 24.77% 1 year total shareholder return and 53.42% 3 year total shareholder return point to stronger momentum over longer periods as investors weigh higher rates, the Heritage Commerce deal, and upcoming earnings.
Compare CVB Financial's setup ahead of earnings with a curated group of banks facing similar rate and deposit pressures through the list of solid balance sheet and fundamentals (25 results).
CVB Financial has rallied strongly over one and three years, even as the last quarter left the stock treading water. If you already see that rebound on the chart, is it smarter to commit now or wait for a cheaper entry point?
Most Popular Narrative: 16% Undervalued
Against the last close at $21.83, the most followed valuation view marks CVB Financial's fair value at $26.00. This frames the earnings story around merger execution and capital efficiency rather than just a share price rebound.
The main thing that has to go right is successful execution on the Heritage integration so that loan levels, cost management, and credit quality continue to support the bank’s long-duration profitability and dividend record.
The current valuation suggests that CVB Financial’s share price does not fully reflect a business that reports 197 consecutive profitable quarters, 147 consecutive quarterly cash dividends, and active capital return through dividends and buybacks.
See why 11 investors see CVB Financial as 16% undervalued.
Result: Fair Value of $26 (UNDERVALUED)
Still, cracks in the narrative are clear, with a thinner 9.8% tangible common equity ratio and the risk that Heritage integration targets for 2027 simply are not met.
Find out about the key risks to this CVB Financial narrative.
Another View: CVB Financial Looks Expensive On Earnings
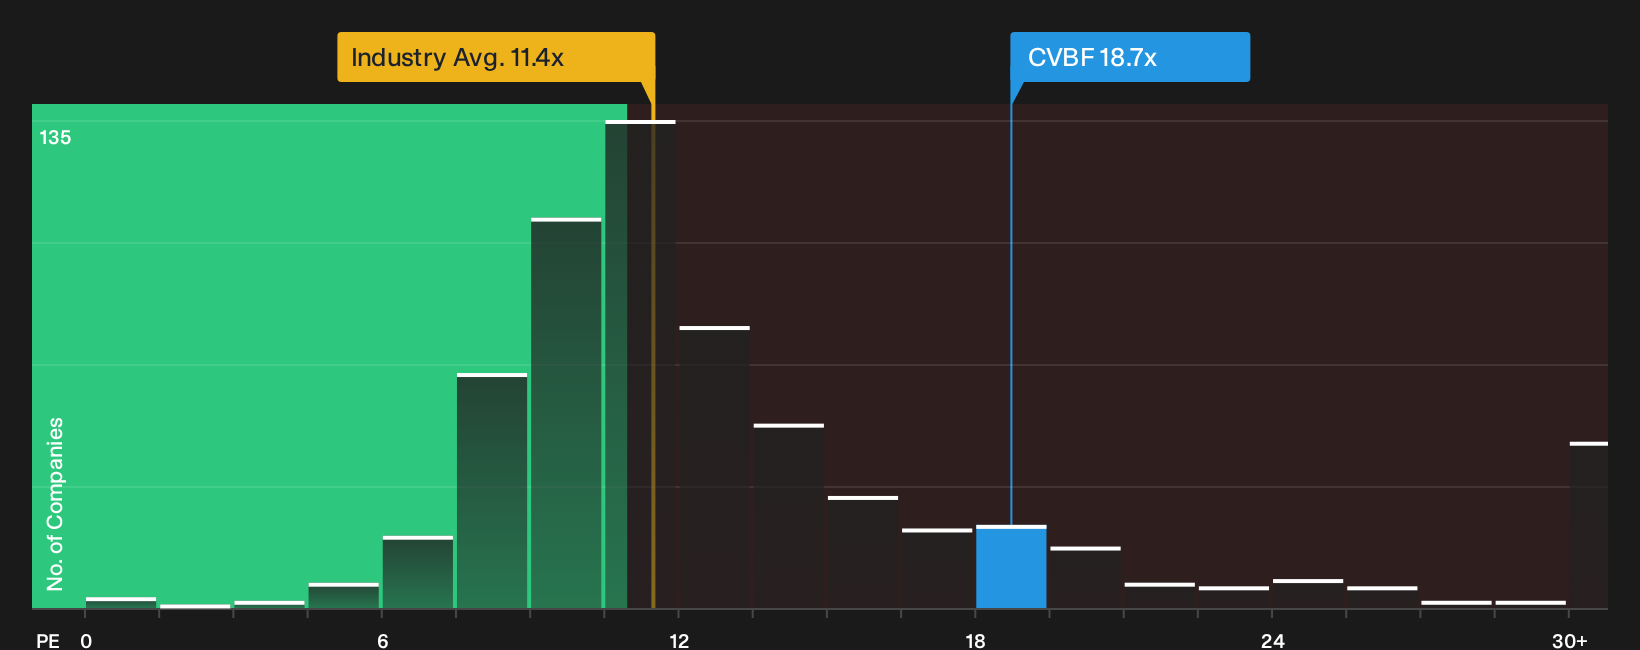
The fair value story for CVB Financial leans on future cash flows and analyst targets, yet the simple P/E check sends a different signal. At 18.7x earnings, CVBF trades well above the US Banks industry on 11.3x and peers on 11.7x, and even above its own 15.9x fair ratio. That gap points to valuation risk if expectations around the Heritage deal or growth ease back, so which signal do you trust more today?
For a closer look at how those earnings multiples line up against fundamentals, See what the numbers say about this price — find out in our valuation breakdown.
Next Steps
Mixed messages on CVB Financial's value story are clear, which is exactly why it pays to move quickly and test the data against your own expectations. To see how the positives and pressure points compare side by side, start with the 3 key rewards and 2 important warning signs.
Looking For More Investment Ideas Beyond CVB Financial?
If CVB Financial has your attention, do not stop here. Broaden your watchlist now or someone else will find the ideas you overlooked.
- Target dependable income streams by scanning for potential high yield opportunities through the 8 dividend fortresses.
- Hunt for quality at a discount by reviewing the 33 high quality undervalued stocks before valuations shift away from you.
- Focus on limiting potential losses and then consider potential gains by starting with a 32 resilient stocks with low risk scores.
This article by Simply Wall St is general in nature. We provide commentary based on historical data and analyst forecasts only using an unbiased methodology and our articles are not intended to be financial advice. It does not constitute a recommendation to buy or sell any stock, and does not take account of your objectives, or your financial situation. We aim to bring you long-term focused analysis driven by fundamental data. Note that our analysis may not factor in the latest price-sensitive company announcements or qualitative material. Simply Wall St has no position in any stocks mentioned.
Have feedback on this article? Concerned about the content? Get in touch with us directly. Alternatively, email editorial-team@simplywallst.com