
Where Is the Stock Market Heading in the Final Months of 2026?
I asked if the VIX index was inexpensive going into the historically volatile fall months in 2026 in an August 20, 2026, Barchart article, where I concluded with the following:
The VIX is a sentiment indicator that signals when market participants rush to buy price insurance for their stock portfolios. The demand for insurance is inversely correlated with the direction of the S&P 500 and other leading U.S. stock market indices. Given the trading ranges in 2024 and 2025, the VIX could be inexpensive at levels below 20, with risk-reward favoring the upside.
The VIX traded at 15.31 on August 19 and was only slightly higher in October 2026. However, the sentiment index that reflects the diversified S&P 500 could still be too low in the current environment.
The VIX has traded between 13.93 and 18.94 since August 19, 2026. The VIX suggests the odds favor a continuation of the bullish trend in stocks, but that could change in the blink of an eye.
A tight range in the VIX
The VIX has traded in a 21.37-point range between 13.93 and 35.30 in 2026, after a 46.75-point range in 2025. The 2025 high occurred after the U.S. administration announced its “Liberation Day” tariff policies. The 2026 range has been less than half that of 2025.
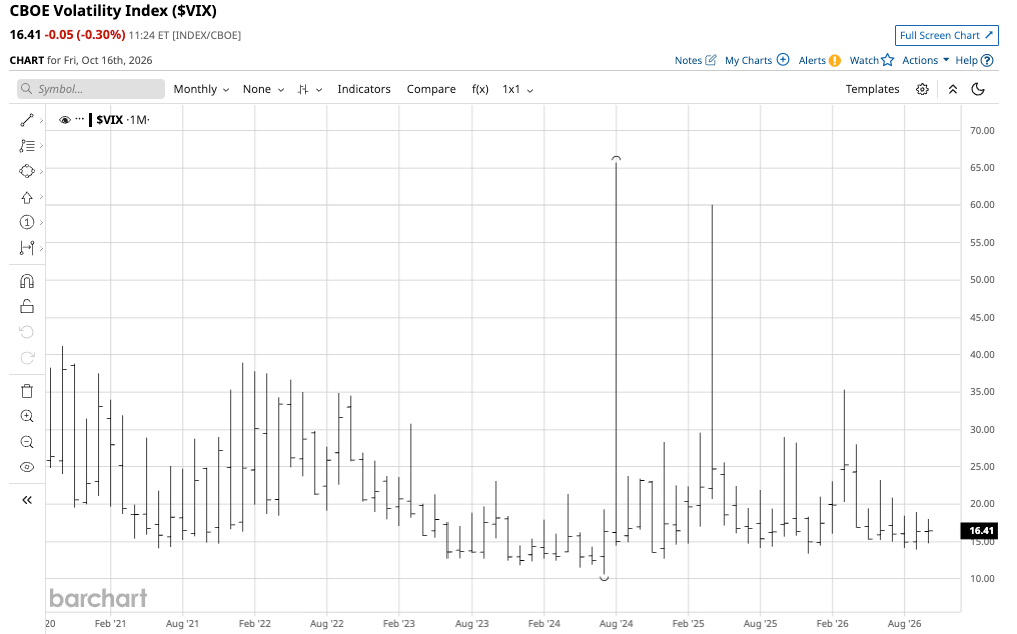
Meanwhile, the monthly chart shows that the 5.01-point range since July 31 is less than one-quarter of the 2026 range. The VIX measures the implied volatility of call and put options on S&P 500 stocks. The S&P 500 is the most diversified U.S. stock market index. The VIX typically rises when the S&P 500 falls and vice versa. At 7,715 on October 16, the S&P 500 was 12.7% higher since the end of 2025. However, the VIX was 10% higher, moving from 14.95 at the end of 2025 to the 16.45 level on October 16. Meanwhile, the VIX was only 2.52 above the 2026 low, and 18.85 below the 2026 high.
The VIX’s downside could be limited over the coming weeks, as many factors support significant stock market volatility.
The U.S. midterm elections
The 2024 U.S. election handed the White House to a Republican administration, with slim majorities in the House of Representatives and Senate. Those majorities provided legislative support for the President’s agenda.
As the November 3 midterm elections approach, historical trends show that the sitting administration tends to lose seats in the House and Senate after two years. Even small losses could flip majorities from Republicans to Democrats. The President’s approval rating has declined because of the war with Iran and inflation-driven affordability issues. However, Democrats face internal strife as the socialist wing challenges moderates, which could shift independent voters toward Republicans. The Democrats have said they are a “big tent” party accepting many ideological opinions, but socialism is a significant departure from the U.S. political capitalist history. Many of the most ardent DSA members running for office support initiatives that could vastly change the U.S. Constitution, future domestic and foreign policies, taxation, regulation, and government involvement in daily life. Moreover, a shift from the political right to the left in legislative majorities will not only stop many of the administration’s initiatives over the next two years, but could also trigger hearings and investigations that lead to impeachment of the President and even some cabinet members.
The bottom line is that uncertainty around midterm elections and the political direction after the outcome could cause significant stock market volatility as November 3 approaches and in its aftermath, depending on the results. The stock market could become volatile over the coming weeks and months.
Lurking geopolitical turmoil
The ongoing war in Ukraine and an escalating conflict in the Middle East can cause substantial U.S. stock market volatility. Sanctions on Russia, Ukrainian attacks on Russian infrastructure and energy production, and a war zone in the logistically critical Black Sea ports continue to roil global markets.
The Strait of Hormuz, Bab al-Mandeb Strait, Iranian attacks on neighboring countries hosting U.S. military assets, and Iranian proxy attacks on Saudi Arabia and Israel have caused markets across all asset classes to move with the daily news cycle. The U.S. insists that Iran abandon its nuclear aspirations, open the Strait of Hormuz, and call off its proxies. Iran has offered proposal after proposal, stalling tactics that have worked with U.S. administrations for nearly five decades. Iran is likely waiting and stalling until after the November 3 election, wagering that a change in the U.S. political will limit the administration’s ability to wage an unpopular war.
Meanwhile, the bifurcation of the world’s nuclear powers, U.S. tariffs and trade policies, and other political and economic issues could surprise markets and drive volatility. Markets tend to experience the most volatility from surprises, as markets learned during the 2008 global financial crisis and the 2020 worldwide pandemic.
Levels to watch in SPY, the S&P 500 ETF
The VIX is a sentiment index measuring the implied volatility of S&P 500 put and call options. The VIX moves contrary to the S&P 500, rising during corrections and falling when stocks appreciate. Options are insurance, and demand for insurance rises when stocks fall, increasing put and call option premiums as higher implied volatility pushes the VIX higher. Meanwhile, option premiums decline when stocks rise as market participants sell put and call options to enhance risk positions by collecting premium, sending implied volatility and the VIX index lower.
The SPDR S&P 500 ETF (SPY) is a highly liquid ETF that tracks the S&P 500 index. At $769.30 per share, SPY had over $815.4 billion in assets under management. SPY trades an average of more than 39 million shares per day and charges a 0.09% management fee.
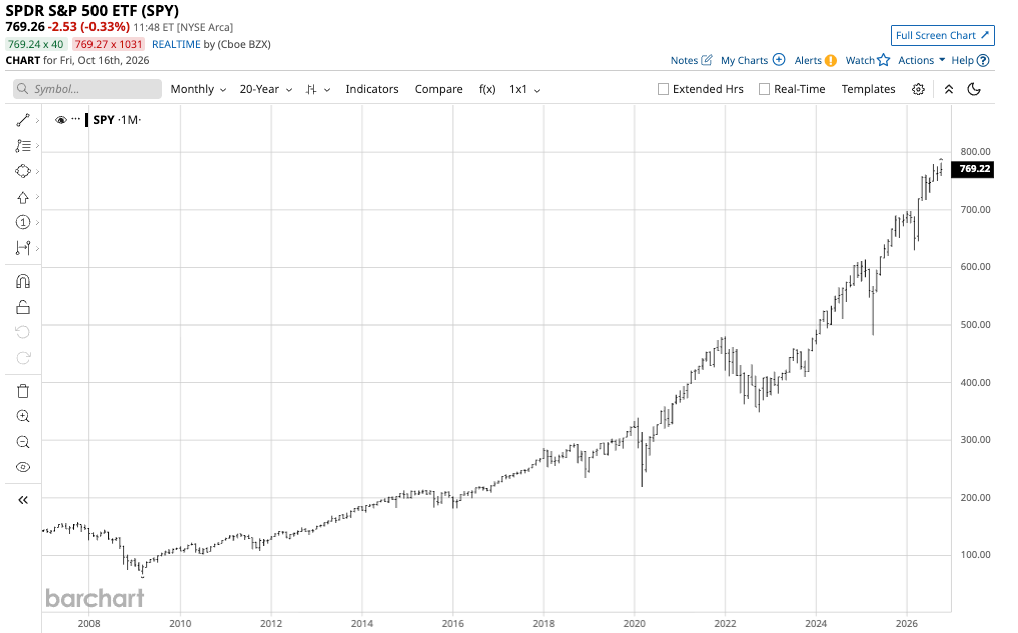
The 20-year monthly chart shows SPY’s bullish trend since 2009. While SPY has made higher record highs over the years, it has experienced significant corrections in 2020 during the pandemic, 2022 after Russia’s invasion of Ukraine, April 2025 after the “Liberation Day” tariff announcement, and most recently in March 2026 as the conflict between the U.S. and Iran began. In October 2026, the first significant technical support level for SPY is the April 2025 low of $629.28, over 18% below the current level. A quick move toward support would likely cause an explosive move in the VIX, doubling, tripling, or even quadrupling from its current level below 16. In 2008, the VIX reached a record high of 89.53, and in 2020 the VIX reached a slightly lower high of 85.47.
Interest rates and crude oil prices are barometers over the coming weeks and months
Crude oil and oil product prices are likely critical factors for the U.S. stock market over the coming days and weeks as rising crude oil puts upward pressure on inflation. At around $98 per barrel, NYMEX crude oil futures are above the midpoint of the 2026 trading range, but the price can move substantially in either direction depending on Middle East events. Higher crude oil and oil product prices will likely weigh on stocks, while falling oil prices could ignite a significant rally by removing some of the economic and geopolitical uncertainties facing markets.
Another important factor is U.S. interest rates. The U.S. dollar remains the world’s reserve currency, even though de-dollarization has reduced its position in recent years. Stubbornly high inflation caused the U.S. Federal Reserve to increase the short-term Fed Funds Rate at its September meeting. The rate hike to a midpoint of 3.875% was the first hike since July 2023.
Meanwhile, U.S. debt has eclipsed $40 trillion in 2026. Rising debt, de-dollarization that pushes buyers of U.S. government debt securities to demand higher yields, stubborn inflation, U.S. trade policies, and geopolitical uncertainty have pushed long-term U.S. interest rates to the highest level in over twenty-four years.
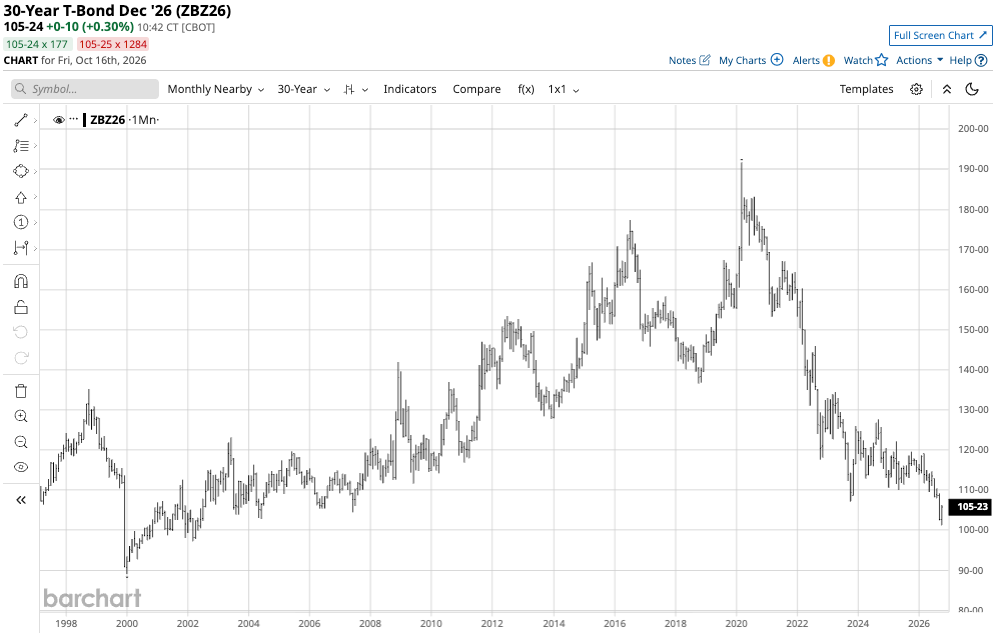
The monthly chart shows that the most recent 101-05 low in the U.S. 30-year Treasury Bond futures was the lowest level since May 2002.
Stocks compete with fixed-income assets for capital. With interest rates rising to the highest level in over two decades, capital flows from stocks to bonds could weigh on the stock market. Moreover, rising rates weigh on corporate profits by increasing financing costs.
In October 2026, the U.S. stock market remains bullish near its most recent record high. However, many factors could cause a significant correction in the blink of an eye. Volatility could increase over the coming weeks as markets reflect the economic and geopolitical landscape. The U.S. stock market could be in the eye of a coming storm.
On the date of publication, Andrew Hecht did not have (either directly or indirectly) positions in any of the securities mentioned in this article. All information and data in this article is solely for informational purposes. For more information please view the Barchart Disclosure Policy here.