
Permian Basin Royalty Trust (PBT) Pulls Back After A Big Run But Still Looks Pricey
Recent performance snapshot for Permian Basin Royalty Trust
Permian Basin Royalty Trust (PBT) has drawn attention after a sharp year-to-date gain of 91.1%, even as the unit price declined 6.9% over the past month and 3.5% across the past week.
Over longer periods, the trust shows a total return of 98.2% over the past year, 74.1% across three years, and roughly 3.7x over five years, highlighting sizeable historical price moves.
Recent momentum for Permian Basin Royalty Trust has cooled, with the share price down 6.9% over 30 days. This follows a 91.1% year-to-date share price return and leaves the current US$33.62 level reflecting both strong past gains and a shift in near term risk appetite.
Scan beyond Permian Basin Royalty Trust's surge and recent pullback by lining up its performance against list of solid balance sheet and fundamentals (25 results) in the same broad opportunity set.
After a near doubling over the past year followed by a recent pullback, Permian Basin Royalty Trust now sits in a grey zone. Does that justify buying today, or waiting for a cleaner entry point as valuations shake out next?
Price-to-Earnings of 96.7x: Is it justified?
Valuation now leans against Permian Basin Royalty Trust. The units last closed at $33.62, while a very rich P/E of 96.7x signals investors are paying a heavy premium compared with similar energy stocks.
The P/E multiple compares the current unit price with earnings per share and is often used for royalty trusts and oil and gas producers where profits can swing with commodity prices. A P/E of 96.7x suggests the market is willing to pay almost 97 years of recent earnings for each unit, which is a demanding starting point for any income focused vehicle.
For PBT, that premium sits alongside earnings that have declined by 2.6% per year over the past 5 years and fell 1.7% over the past year, even though reported profit margins are high. This combination indicates buyers are treating recent profitability as durable and placing a lot of weight on the trust's current cash generation despite the earnings decline profile.
The gap versus peers is wide. PBT trades on a P/E of 96.7x compared with a peer average of 16.2x and a US Oil and Gas sector average of 12.2x, which points to a much more expensive valuation than both direct comparables and the broader industry.
See what the numbers say about this price — find out in our valuation breakdown.
Result: Price-to-Earnings of 96.7x (OVERVALUED)
Still, the story around Permian Basin Royalty Trust can change quickly if earnings soften further or if investors begin to question such a steep P/E premium.
Find out about the key risks to this Permian Basin Royalty Trust narrative.
Another view on Permian Basin Royalty Trust using cash flows
The steep P/E multiple tells one story. Our DCF model tells another. On that framework, Permian Basin Royalty Trust at $33.62 trades well above an estimated future cash flow value of $7.98, which flags a wide gap that readers need to judge for themselves.
Look into how the SWS DCF model arrives at its fair value.
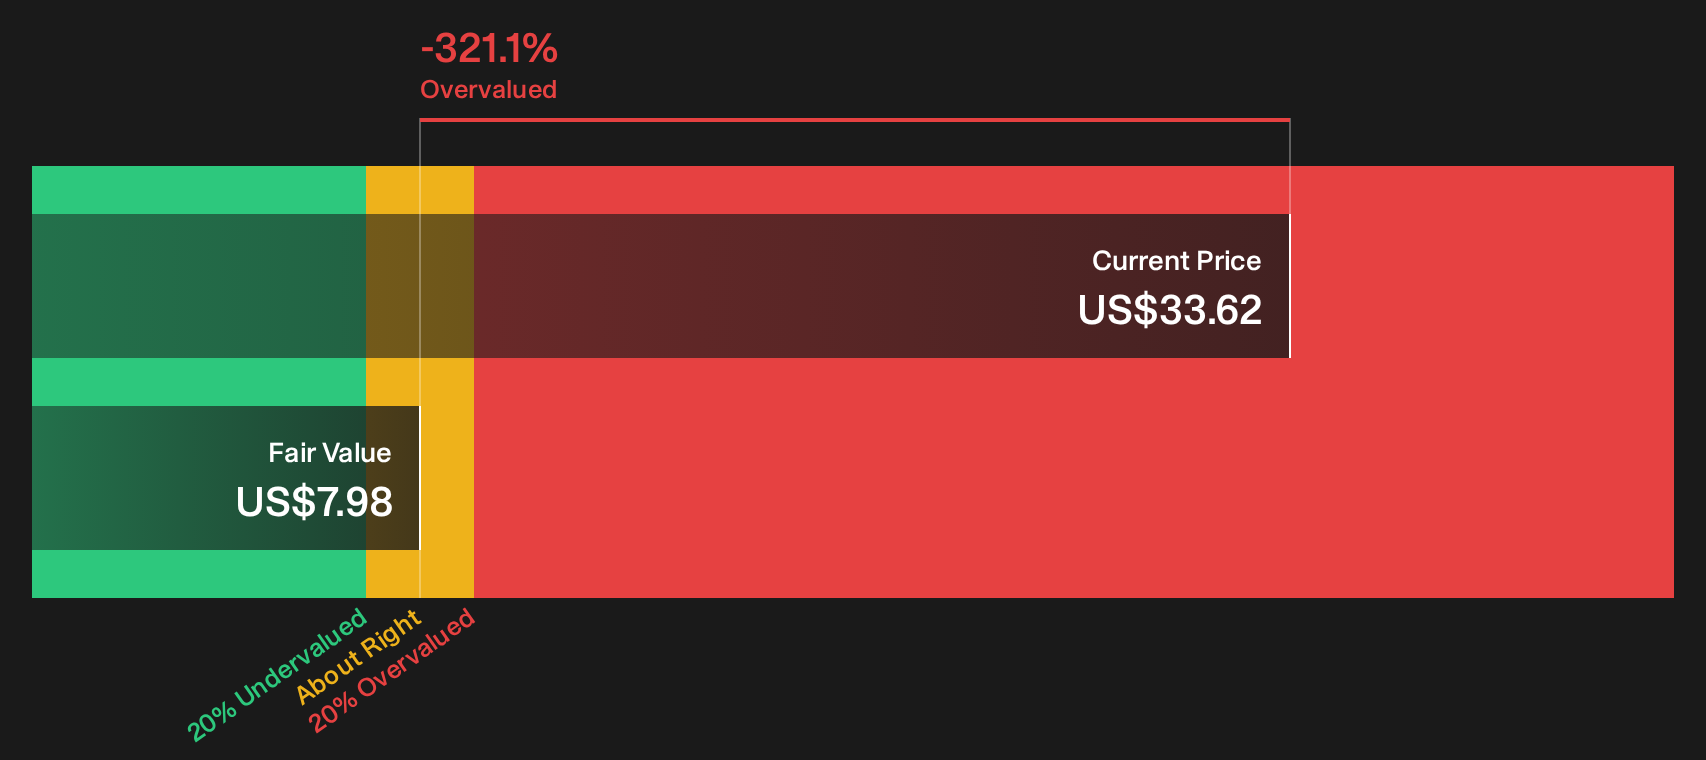
Simply Wall St performs a discounted cash flow (DCF) on every stock in the world every day (check out Permian Basin Royalty Trust for example). We show the entire calculation in full. You can track the result in your watchlist or portfolio and be alerted when this changes, or use our stock screener to discover 33 high quality undervalued stocks. If you save a screener we even alert you when new companies match - so you never miss a potential opportunity.
Next Steps
Concerned by how stretched or fragile Permian Basin Royalty Trust now looks on the numbers. Move fast, review the red flags for yourself, and scrutinise the 1 important warning sign.
Looking for more investment ideas beyond Permian Basin Royalty Trust?
If Permian Basin Royalty Trust feels fully priced, use the Simply Wall St Screener to quickly surface other shares that better match your return and risk preferences.
- Target potential mispricings by scanning for businesses with strong fundamentals using the 33 high quality undervalued stocks.
- Lock in income ideas by filtering for resilient payers inside the 8 dividend fortresses.
- Dial down portfolio stress by focusing on sturdier balance sheets through the 32 resilient stocks with low risk scores.
This article by Simply Wall St is general in nature. We provide commentary based on historical data and analyst forecasts only using an unbiased methodology and our articles are not intended to be financial advice. It does not constitute a recommendation to buy or sell any stock, and does not take account of your objectives, or your financial situation. We aim to bring you long-term focused analysis driven by fundamental data. Note that our analysis may not factor in the latest price-sensitive company announcements or qualitative material. Simply Wall St has no position in any stocks mentioned.
Have feedback on this article? Concerned about the content? Get in touch with us directly. Alternatively, email editorial-team@simplywallst.com