
3 Asian Stocks That May Be Trading At Up To 40.6% Below Intrinsic Value Estimates
Amidst the ongoing volatility in global markets, Asian equities have shown a mixed performance, with some indices experiencing gains driven by technology and semiconductor sectors. In this environment, identifying stocks that are potentially undervalued can be crucial for investors looking to capitalize on discrepancies between market prices and intrinsic value estimates.
Top 10 Undervalued Stocks Based On Cash Flows In Asia
| Name | Current Price | Fair Value (Est) | Discount (Est) |
| XTC New Energy Materials(Xiamen)Ltd (SHSE:688778) | CN¥38.68 | CN¥75.56 | 48.8% |
| Riken Technos (TSE:4220) | ¥2391.00 | ¥4766.49 | 49.8% |
| Nissui (TSE:1332) | ¥1098.00 | ¥2153.17 | 49% |
| Kingnet Network (SZSE:002517) | CN¥15.42 | CN¥30.52 | 49.5% |
| KB Financial Group (KOSE:A105560) | ₩156700.00 | ₩304269.99 | 48.5% |
| ENN Energy Holdings (SEHK:2688) | HK$49.54 | HK$97.00 | 48.9% |
| Cuckoo Holdings (KOSE:A192400) | ₩26500.00 | ₩50923.26 | 48% |
| China Coal Energy (SEHK:1898) | HK$10.35 | HK$20.14 | 48.6% |
| China Automotive Engineering Research Institute (SHSE:601965) | CN¥13.64 | CN¥26.46 | 48.4% |
| Central Automotive Products (TSE:8117) | ¥2012.00 | ¥3900.46 | 48.4% |
Let's review some notable picks from our screened stocks.
Kitazato (TSE:368A)
Overview: Kitazato Corporation focuses on the research, development, manufacturing, and marketing of medical devices and reagents for fertility treatment, with a market capitalization of ¥57.24 billion.
Operations: The company generates revenue primarily from its Medical Equipment Business, which accounts for ¥11.53 billion.
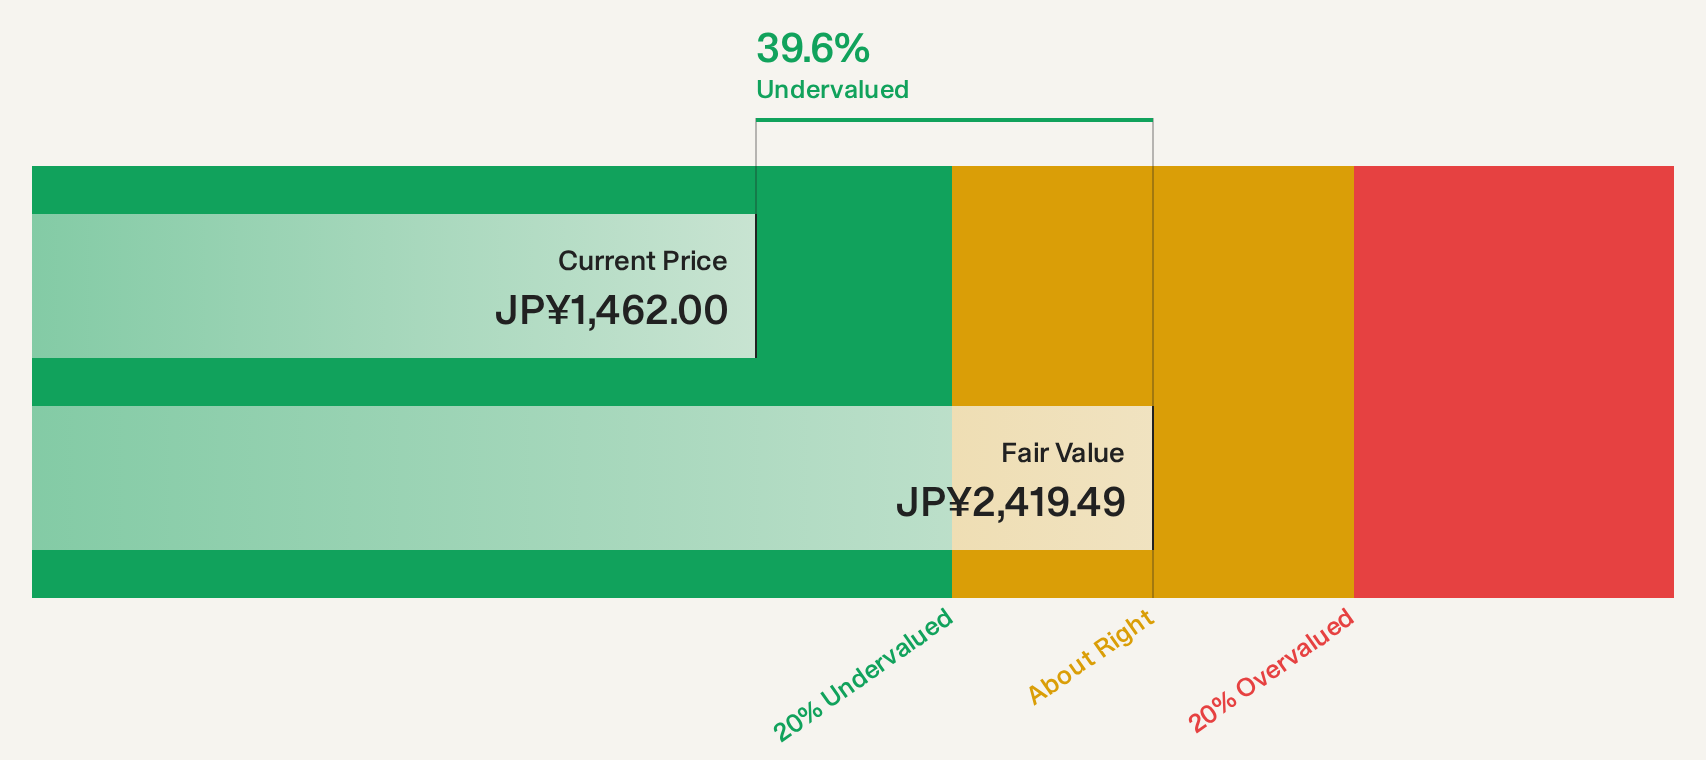
Estimated Discount To Fair Value: 40.6%
Kitazato is trading at ¥1,431, significantly below its estimated future cash flow value of ¥2,408.94 and 40.6% under its fair value estimate. Despite earnings growth of 12% last year and a forecasted annual profit increase of 8%, this lags behind the Japanese market's expected growth rate. Revenue is anticipated to grow by 7.2% annually, slightly above the market average but not significantly high overall. Recent guidance predicts stable dividends and solid profits for FY2027.
- Our growth report here indicates Kitazato may be poised for an improving outlook.
- Click here to discover the nuances of Kitazato with our detailed financial health report.
Rinnai (TSE:5947)
Overview: Rinnai Corporation manufactures and sells thermal equipment across Japan, the United States, Australia, China, South Korea, Indonesia, and other international markets with a market cap of ¥469.36 billion.
Operations: Rinnai's revenue is primarily generated from Japan (¥253.66 billion), the United States (¥73.58 billion), China (¥61.78 billion), Australia (¥47.62 billion), South Korea (¥35.37 billion), and Indonesia (¥19.11 billion).
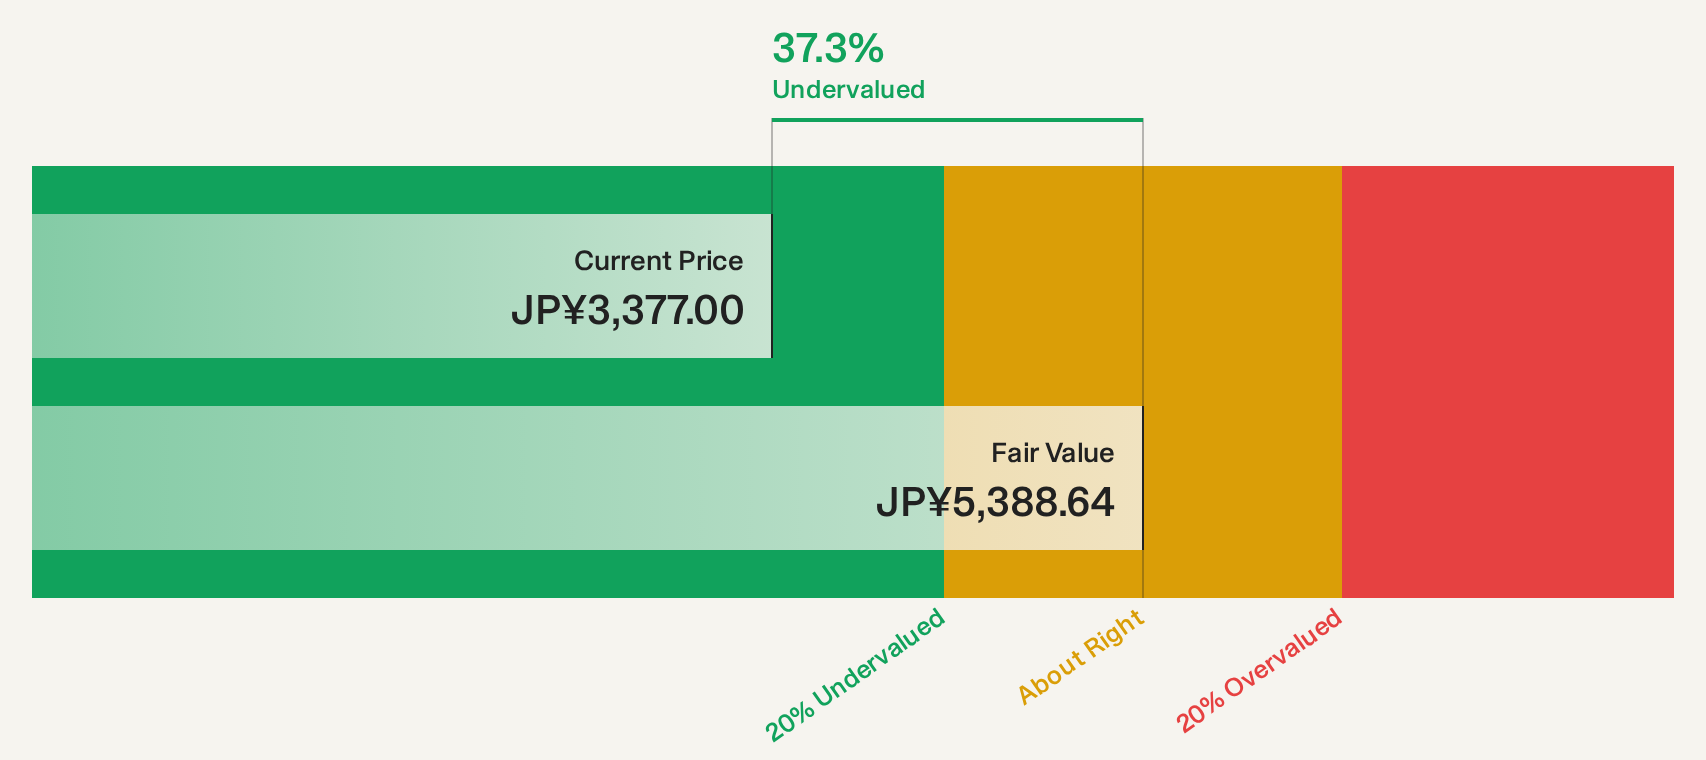
Estimated Discount To Fair Value: 38%
Rinnai's stock is trading at ¥3,399, well below its estimated future cash flow value of ¥5,486.54 and 38% under its fair value estimate. Recent earnings showed modest growth with net income rising to ¥6.74 billion for the first quarter of 2026. Analysts expect a 27.9% price increase despite forecasted revenue and earnings growth trailing the Japanese market averages. Dividend guidance indicates a slight increase to ¥53 per share for FY2027, reflecting steady shareholder returns amidst moderate profit expansion expectations.
- In light of our recent growth report, it seems possible that Rinnai's financial performance will exceed current levels.
- Get an in-depth perspective on Rinnai's balance sheet by reading our health report here.
TABAYA HOLDINGS (TSE:7606)
Overview: TABAYA HOLDINGS Co., Ltd. is involved in the planning, purchasing, and retailing of men's and women's apparel, accessories, and other products in Japan with a market capitalization of ¥67.02 billion.
Operations: The company generates revenue of ¥166.20 billion from its Clothing Retail Business segment, which includes the sale of men's and women's apparel and accessories in Japan.
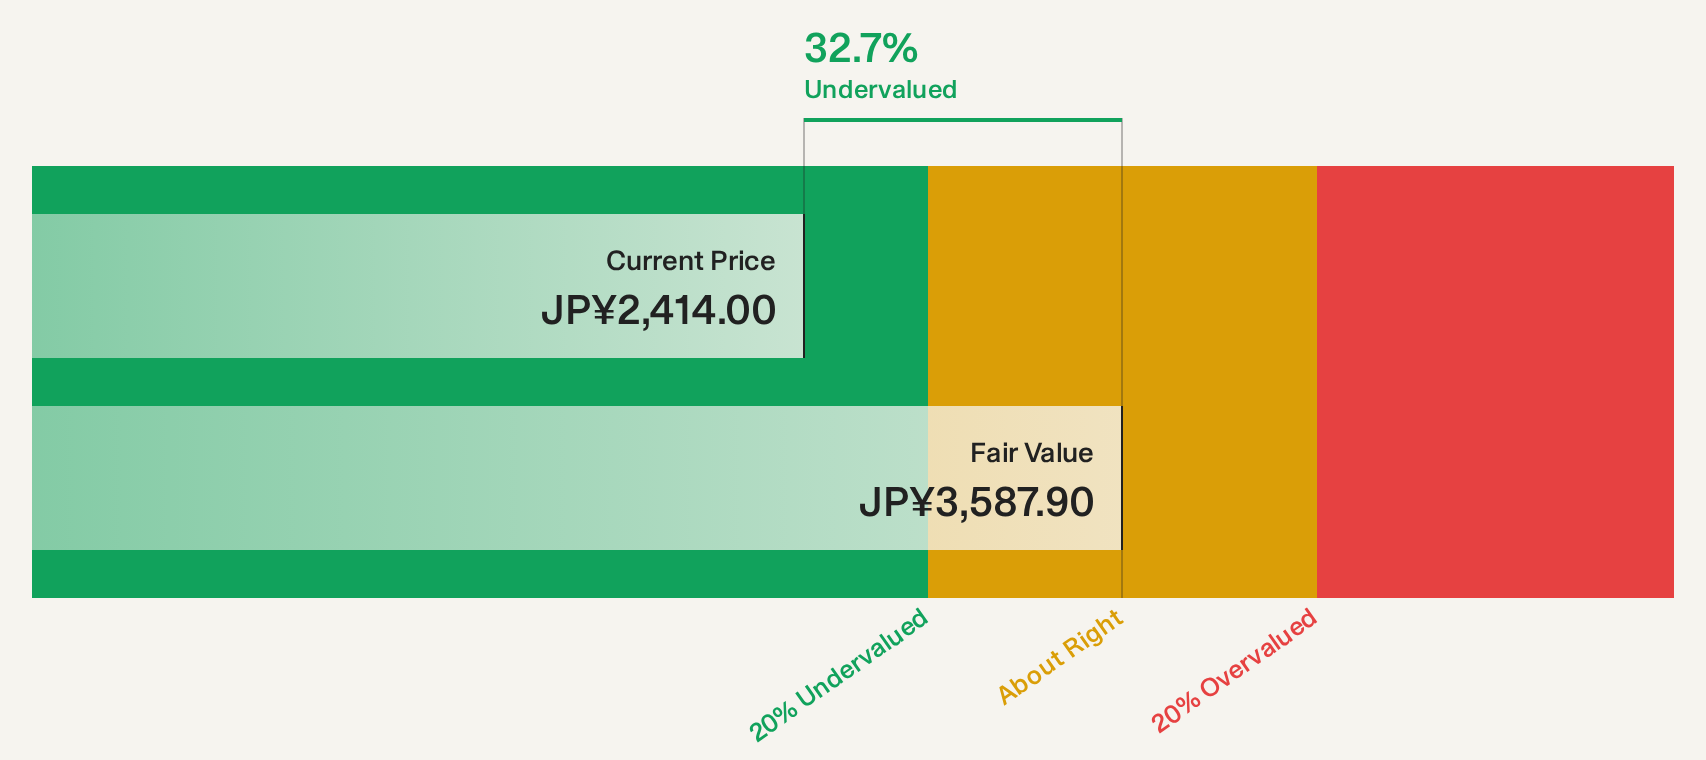
Estimated Discount To Fair Value: 26%
TABAYA HOLDINGS is trading at ¥2,500, significantly below its estimated future cash flow value of ¥3,376.38. Despite a 70% earnings growth over the past year, its forecasted annual profit growth of 3.8% lags behind the Japanese market average of 9.6%. Recent sales reports show robust performance with total sales increasing by over 10% for the month and second quarter ended September 2026. However, an unstable dividend track record remains a concern for investors seeking consistent returns.
- Our expertly prepared growth report on TABAYA HOLDINGS implies its future financial outlook may be stronger than recent results.
- Unlock comprehensive insights into our analysis of TABAYA HOLDINGS stock in this financial health report.
Seize The Opportunity
- Delve into our full catalog of 187 Undervalued Asian Stocks Based On Cash Flows here.
- Are any of these part of your asset mix? Tap into the analytical power of Simply Wall St's portfolio to get a 360-degree view on how they're shaping up.
- Take control of your financial future using Simply Wall St, offering free, in-depth knowledge of international markets to every investor.
Ready For A Different Approach?
- Explore high-performing small cap companies that haven't yet garnered significant analyst attention.
- Diversify your portfolio with solid dividend payers offering reliable income streams to weather potential market turbulence.
- Fuel your portfolio with companies showing strong growth potential, backed by optimistic outlooks both from analysts and management.
This article by Simply Wall St is general in nature. We provide commentary based on historical data and analyst forecasts only using an unbiased methodology and our articles are not intended to be financial advice. It does not constitute a recommendation to buy or sell any stock, and does not take account of your objectives, or your financial situation. We aim to bring you long-term focused analysis driven by fundamental data. Note that our analysis may not factor in the latest price-sensitive company announcements or qualitative material. Simply Wall St has no position in any stocks mentioned.
Have feedback on this article? Concerned about the content? Get in touch with us directly. Alternatively, email editorial-team@simplywallst.com