
Companies Like OpenDoor (TSE:3926) Are In A Position To Invest In Growth
We can readily understand why investors are attracted to unprofitable companies. For example, biotech and mining exploration companies often lose money for years before finding success with a new treatment or mineral discovery. But the harsh reality is that very many loss making companies burn through all their cash and go bankrupt.
So, the natural question for OpenDoor (TSE:3926) shareholders is whether they should be concerned by its rate of cash burn. In this report, we will consider the company's annual negative free cash flow, henceforth referring to it as the 'cash burn'. Let's start with an examination of the business' cash, relative to its cash burn.
When Might OpenDoor Run Out Of Money?
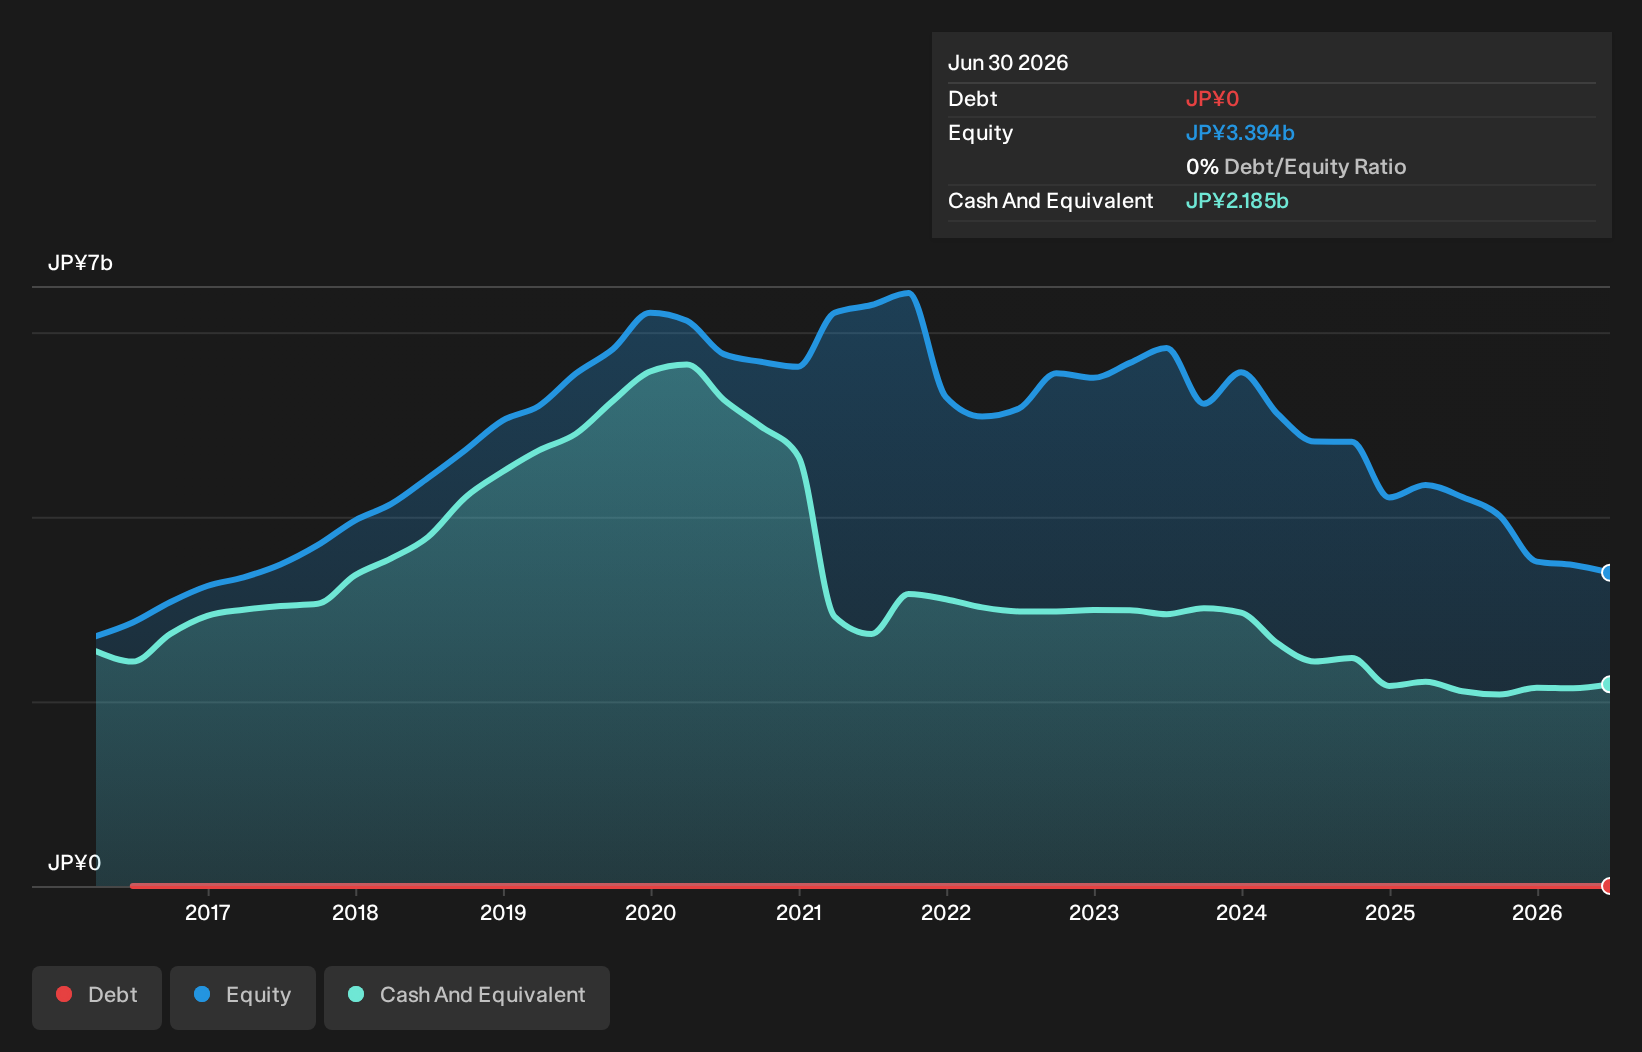
A company's cash runway is calculated by dividing its cash hoard by its cash burn. In June 2026, OpenDoor had JP¥2.2b in cash, and was debt-free. Importantly, its cash burn was JP¥60m over the trailing twelve months. That means it had a cash runway of very many years as of June 2026. Even though this is but one measure of the company's cash burn, the thought of such a long cash runway warms our bellies in a comforting way. The image below shows how its cash balance has been changing over the last few years.
See our latest analysis for OpenDoor
How Well Is OpenDoor Growing?
On balance, we think it's mildly positive that OpenDoor trimmed its cash burn by 5.9% over the last twelve months. Revenue also improved during the period, increasing by 3.4%. Considering both these factors, we're not particularly excited by its growth profile. Clearly, however, the crucial factor is whether the company will grow its business going forward. For that reason, it makes a lot of sense to take a look at our analyst forecasts for the company.
How Hard Would It Be For OpenDoor To Raise More Cash For Growth?
While OpenDoor seems to be in a decent position, we reckon it is still worth thinking about how easily it could raise more cash, if that proved desirable. Generally speaking, a listed business can raise new cash through issuing shares or taking on debt. One of the main advantages held by publicly listed companies is that they can sell shares to investors to raise cash and fund growth. We can compare a company's cash burn to its market capitalisation to get a sense for how many new shares a company would have to issue to fund one year's operations.
OpenDoor has a market capitalisation of JP¥15b and burnt through JP¥60m last year, which is 0.4% of the company's market value. So it could almost certainly just borrow a little to fund another year's growth, or else easily raise the cash by issuing a few shares.
How Risky Is OpenDoor's Cash Burn Situation?
As you can probably tell by now, we're not too worried about OpenDoor's cash burn. In particular, we think its cash runway stands out as evidence that the company is well on top of its spending. Its weak point is its revenue growth, but even that wasn't too bad! After taking into account the various metrics mentioned in this report, we're pretty comfortable with how the company is spending its cash, as it seems on track to meet its needs over the medium term. Separately, we looked at different risks affecting the company and spotted 2 warning signs for OpenDoor (of which 1 is potentially serious!) you should know about.
Of course, you might find a fantastic investment by looking elsewhere. So take a peek at this free list of companies with significant insider holdings, and this list of stocks growth stocks (according to analyst forecasts)
Have feedback on this article? Concerned about the content? Get in touch with us directly. Alternatively, email editorial-team (at) simplywallst.com.
This article by Simply Wall St is general in nature. We provide commentary based on historical data and analyst forecasts only using an unbiased methodology and our articles are not intended to be financial advice. It does not constitute a recommendation to buy or sell any stock, and does not take account of your objectives, or your financial situation. We aim to bring you long-term focused analysis driven by fundamental data. Note that our analysis may not factor in the latest price-sensitive company announcements or qualitative material. Simply Wall St has no position in any stocks mentioned.