
Is CMS Energy (CMS) Cheap As It Prepares For Its Special Call And Q3 Results?
Why CMS Energy Stock Is Back In Focus
CMS Energy (CMS) is drawing attention after scheduling a special call and preparing to report fiscal Q3 2026 results on October 27, following a move away from non utility renewables development.
Recent trading has been choppy, with CMS Energy’s share price down about 10.4% over the past 90 days and 5.9% year to date. However, the 3 year total shareholder return of 34.3% signals that longer term holders have still seen meaningful gains as attention now shifts to the special call and Q3 update.
Scan beyond CMS Energy and compare its setup to a hand picked group of regulated utility peers and other resilient operators using the 32 resilient stocks with low risk scores.
CMS Energy now trades at a clear discount to both analyst targets and certain intrinsic value estimates. The key question is where fair value falls within that gap, given the recent refocus on regulated utilities.
Preferred Multiple of 20.5x P/E: Is It Justified?
Valuation on CMS Energy today leans heavily on earnings, with the stock trading on a P/E ratio of 20.5x versus a last close of $66.30. That puts the utility on terms that look close to what recent cash generation and profit forecasts suggest investors are willing to pay.
The P/E multiple compares the share price to earnings per share, which effectively shows how many dollars investors are paying for each dollar of profit. For a regulated utility like CMS Energy, where earnings growth is usually steadier and less explosive, the P/E ratio often reflects how dependable those profits appear and how sustainable any dividend looks over time.
CMS Energy is flagged as good value based on its 20.5x P/E when lined up against a peer average of 21x, which suggests the market is not applying a premium despite CMS delivering 8.5% annual earnings growth over the past 5 years. At the same time, the same framework labels CMS as expensive relative to an estimated fair P/E of 20.4x. This is a signal that pricing is finely balanced and the market could reasonably shift either toward a small discount or a small premium if expectations around earnings or cash flows change.
The comparison steps up when measured against the wider Global Integrated Utilities group, where the average P/E sits at 17.9x and CMS Energy trades on a noticeably higher multiple. That stronger pricing sends a clear message that investors are willing to pay more than they do for the broader sector, even as interest coverage is described as tight and dividend payments are not fully backed by free cash flow.
Explore the SWS fair ratio for CMS Energy.
Result: Preferred multiple of 20.5x price-to-earnings (ABOUT RIGHT)
Still, tighter interest coverage and dividends that are not fully supported by free cash flow could pressure CMS Energy’s valuation if funding costs or capital needs change.
Find out about the key risks to this CMS Energy narrative.
Another View On CMS Energy’s Value
The earnings multiple paints CMS Energy as roughly fairly priced, yet the SWS DCF model points a little higher. On that cash flow view, the shares at $66.30 sit about 6.6% below an estimated value of $71, which suggests a modest cushion rather than a wide margin. For investors weighing that small gap, the real question is how comfortable they feel relying on long term forecasts for a regulated utility.
Look into how the SWS DCF model arrives at its fair value.
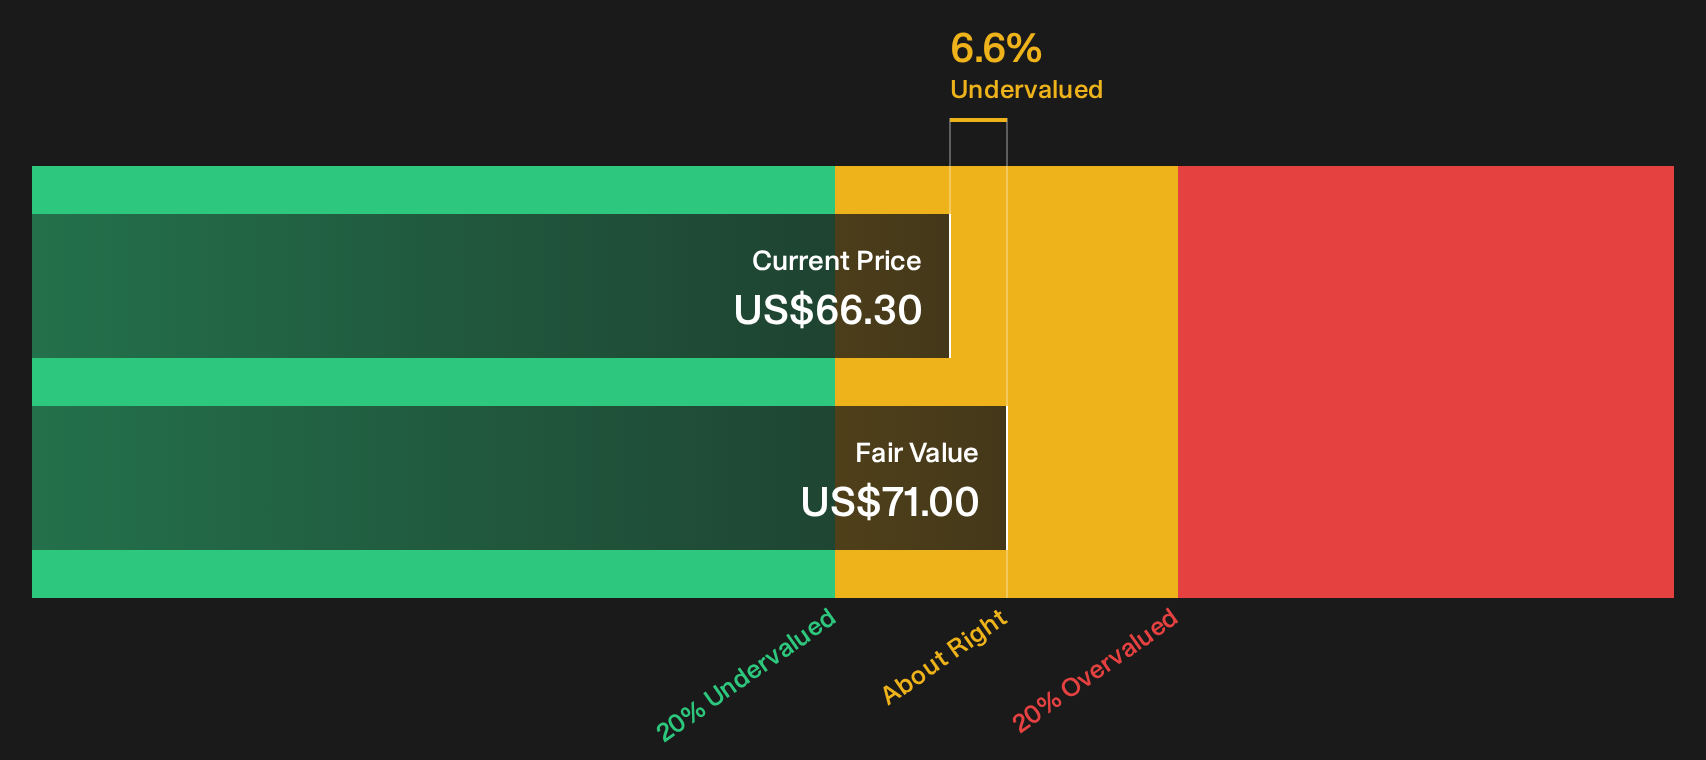
Simply Wall St performs a discounted cash flow (DCF) on every stock in the world every day (check out CMS Energy for example). We show the entire calculation in full. You can track the result in your watchlist or portfolio and be alerted when this changes, or use our stock screener to discover 32 high quality undervalued stocks. If you save a screener we even alert you when new companies match - so you never miss a potential opportunity.
Next Steps
Mixed signals around CMS Energy’s valuation and its refocus on regulated utilities make this a stock you need to judge on your own timetable. To weigh those cross currents properly, start with the full view of risks and potential upsides in the 3 key rewards and 2 important warning signs.
Looking For More CMS Energy Style Ideas?
If CMS Energy has you rethinking your watchlist, do not stop here. Use the Simply Wall Street Screener to quickly surface fresh, high conviction ideas across sectors.
- Target stronger income potential by reviewing reliable high yield candidates in the 8 dividend fortresses.
- Hunt for mispriced opportunities using the 32 high quality undervalued stocks before the rest of the market catches on.
- Prioritise staying power by zeroing in on companies with robust finances through the list of solid balance sheet and fundamentals (25 results).
This article by Simply Wall St is general in nature. We provide commentary based on historical data and analyst forecasts only using an unbiased methodology and our articles are not intended to be financial advice. It does not constitute a recommendation to buy or sell any stock, and does not take account of your objectives, or your financial situation. We aim to bring you long-term focused analysis driven by fundamental data. Note that our analysis may not factor in the latest price-sensitive company announcements or qualitative material. Simply Wall St has no position in any stocks mentioned.
Have feedback on this article? Concerned about the content? Get in touch with us directly. Alternatively, email editorial-team@simplywallst.com