
Why W. R. Berkley (WRB) Is Back In The Spotlight
Analysts have become more positive on W. R. Berkley (WRB) ahead of its upcoming September quarter results, citing higher consensus EPS forecasts and a positive Earnings ESP as key drivers of that shift.
Recent trading has already started to reflect the stronger earnings mood, with W. R. Berkley’s share price up 5.6% over the past week and 6.0% year to date at US$73.55. However, a 1-year total shareholder return that declined 3.6% contrasts with a much stronger 3-year total shareholder return of about 79%, suggesting longer term momentum has been firmer than the most recent year implies.
Spot fresh earnings stories that rhyme with W. R. Berkley by scanning our hand picked 20 high quality undiscovered gems across insurance and other cash generative sectors.W. R. Berkley has the track record and scale of a serious insurer, and the latest price pop reflects that reputation. The real question now is whether the current US$73.55 tag already captures that quality.
Most Popular Narrative: 6% Overvalued
On the headline numbers, the most widely followed narrative pegs W. R. Berkley’s fair value at about $69.41. This sits below the recent $73.55 close and frames the current strength as slightly ahead of that view of worth, even with a solid long term earnings record in place.
The current valuation, alongside this narrative’s view that W. R. Berkley is fairly valued and positive on its prospects, implies that the market is already pricing in sustained high returns on equity and ongoing capital returns through dividends and share repurchases.
See why 6 investors see W. R. Berkley as 6% overvalued.
Result: Fair Value of $69.41 (OVERVALUED)
Still, the story around W. R. Berkley can change quickly if competition keeps eroding pricing discipline or if softer commercial rates bite into underwriting margins.
Find out about the key risks to this W. R. Berkley narrative.
Another View On W. R. Berkley’s Valuation
Analysts describing W. R. Berkley as about 6% overvalued on a fair value of $69.41 typically focus on earnings and price targets. A different lens comes from Simply Wall St’s DCF model, which points to a future cash flow value of $123.82 per share, compared with the current $73.55 price.
That gap is large enough to matter for anyone weighing long term upside against forecast risk. The DCF view suggests cash generation could justify a higher valuation, while the consensus target reflects a more cautious perspective. Which reference point you treat as your anchor becomes an important question when the market appears this divided.
Look into how the SWS DCF model arrives at its fair value.
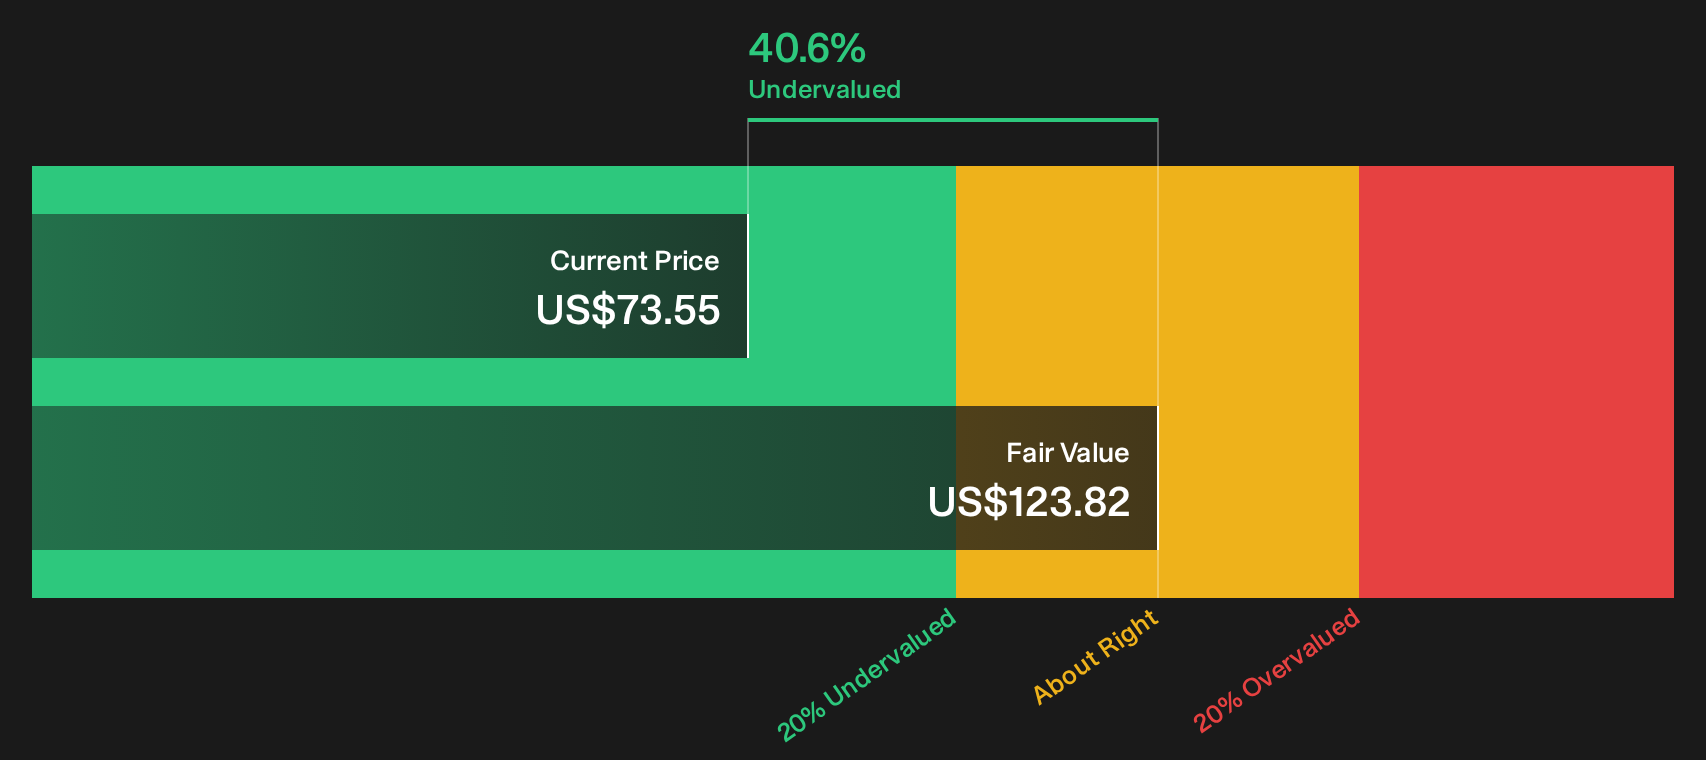
Simply Wall St performs a discounted cash flow (DCF) on every stock in the world every day (check out W. R. Berkley for example). We show the entire calculation in full. You can track the result in your watchlist or portfolio and be alerted when this changes, or use our stock screener to discover 32 high quality undervalued stocks. If you save a screener we even alert you when new companies match - so you never miss a potential opportunity.
Next Steps
Sentiment on W. R. Berkley is mixed enough that it deserves your own verdict, so move quickly to weigh both sides using the 2 key rewards and 2 important warning signs.
Looking for more investment ideas beyond W. R. Berkley?
Do not stop with one ticker. Use the broader toolset to pressure test your thesis, compare opportunities, and build a watchlist that actually reflects your goals.
- Target potential mispricings by scanning a curated 32 high quality undervalued stocks that filters for quality businesses trading below what their fundamentals might justify.
- Strengthen your income stream by reviewing a focused 8 dividend fortresses built around higher yield payouts and balance sheets that can support them.
- Dial down portfolio stress by concentrating on a 32 resilient stocks with low risk scores that prioritises resilient operations and stronger financial footing.
This article by Simply Wall St is general in nature. We provide commentary based on historical data and analyst forecasts only using an unbiased methodology and our articles are not intended to be financial advice. It does not constitute a recommendation to buy or sell any stock, and does not take account of your objectives, or your financial situation. We aim to bring you long-term focused analysis driven by fundamental data. Note that our analysis may not factor in the latest price-sensitive company announcements or qualitative material. Simply Wall St has no position in any stocks mentioned.
Have feedback on this article? Concerned about the content? Get in touch with us directly. Alternatively, email editorial-team@simplywallst.com