
TSX Growth Companies With High Insider Ownership
As the Canadian market continues to ride the wave of a resilient bull market, marked by AI-driven growth and concentrated leadership, investors are keenly observing how these trends influence investment opportunities. In this environment, companies with high insider ownership can often signal strong alignment between management and shareholders' interests, making them compelling candidates for those seeking growth potential in the ever-evolving landscape of Canadian equities.
Top 10 Growth Companies With High Insider Ownership In Canada
| Name | Insider Ownership | Earnings Growth |
| ROK Resources (TSXV:ROK) | 16.9% | 130% |
| Propel Holdings (TSX:PRL) | 25.7% | 33.7% |
| Hammond Power Solutions (TSX:HPS.A) | 27.1% | 32.1% |
| Electrovaya (TSX:ELVA) | 34.9% | 41.2% |
| Cizzle Brands (NEOE:CZZL) | 13.2% | 90.4% |
| CHAR Technologies (TSXV:YES) | 21.1% | 83.5% |
| CEMATRIX (TSX:CEMX) | 10.7% | 28.6% |
| Cambria Gold Mines (TSXV:CAMB) | 12% | 85.3% |
| Allied Gold (TSX:AAUC) | 15.4% | 39.4% |
| Abcourt Mines (TSXV:ABI) | 33.2% | 46.5% |
Let's take a closer look at a couple of our picks from the screened companies.
Cascades (TSX:CAS)
Simply Wall St Growth Rating: ★★★★☆☆
Overview: Cascades Inc., along with its subsidiaries, is involved in the production, conversion, and marketing of packaging and tissue products in Canada and the United States, with a market cap of CA$1.81 billion.
Operations: The company's revenue is primarily derived from its Packaging Products segment, which generated CA$3.04 billion, and its Tissue Papers segment, which contributed CA$1.61 billion.
Insider Ownership: 23.5%
Earnings Growth Forecast: 34.7% p.a.
Cascades Inc. is positioned as a growth company with high insider ownership, showcasing significant earnings growth potential at 34.7% annually, outpacing the Canadian market's 11.6%. Despite trading at 57.4% below fair value and facing challenges in covering interest payments with earnings, Cascades maintains a reliable dividend yield of 2.62%. Recent product innovations like the eco-friendly lithoURB paperboard align with sustainable trends and have garnered industry recognition, potentially driving future revenue growth.
- Click to explore a detailed breakdown of our findings in Cascades' earnings growth report.
- Insights from our recent valuation report point to the potential undervaluation of Cascades shares in the market.
ADF Group (TSX:DRX)
Simply Wall St Growth Rating: ★★★★☆☆
Overview: ADF Group Inc. specializes in the design and engineering of connections, including industrial coatings, in Canada and the United States, with a market cap of CA$442.57 million.
Operations: The company generates revenue of CA$344.50 million from the non-residential construction industry in Canada and the United States.
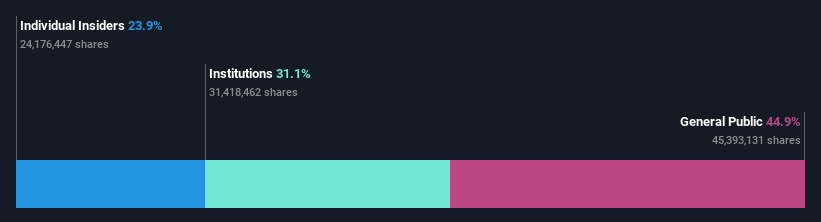
Insider Ownership: 28.3%
Earnings Growth Forecast: 34.5% p.a.
ADF Group's earnings are forecast to grow significantly at 34.55% annually, surpassing the Canadian market's 11.6%. Despite profit margins declining from 13.2% to 9.2%, the company trades at a substantial discount of 54.6% below its estimated fair value, indicating potential undervaluation for investors focused on growth and insider ownership dynamics. Recent financials reveal strong sales growth, with second-quarter revenue reaching C$95.03 million compared to C$53.01 million last year, reflecting robust operational performance.
- Unlock comprehensive insights into our analysis of ADF Group stock in this growth report.
- Our expertly prepared valuation report ADF Group implies its share price may be lower than expected.

Mattr (TSX:MATR)
Simply Wall St Growth Rating: ★★★★☆☆
Overview: Mattr Corp. is a materials technology company serving various infrastructure markets such as electrification, transportation, and energy across multiple regions including Canada, the United States, and Europe, with a market cap of CA$1.33 billion.
Operations: The company generates its revenue from two main segments: Composite Technologies, contributing CA$555.61 million, and Connection Technologies, accounting for CA$789.78 million.
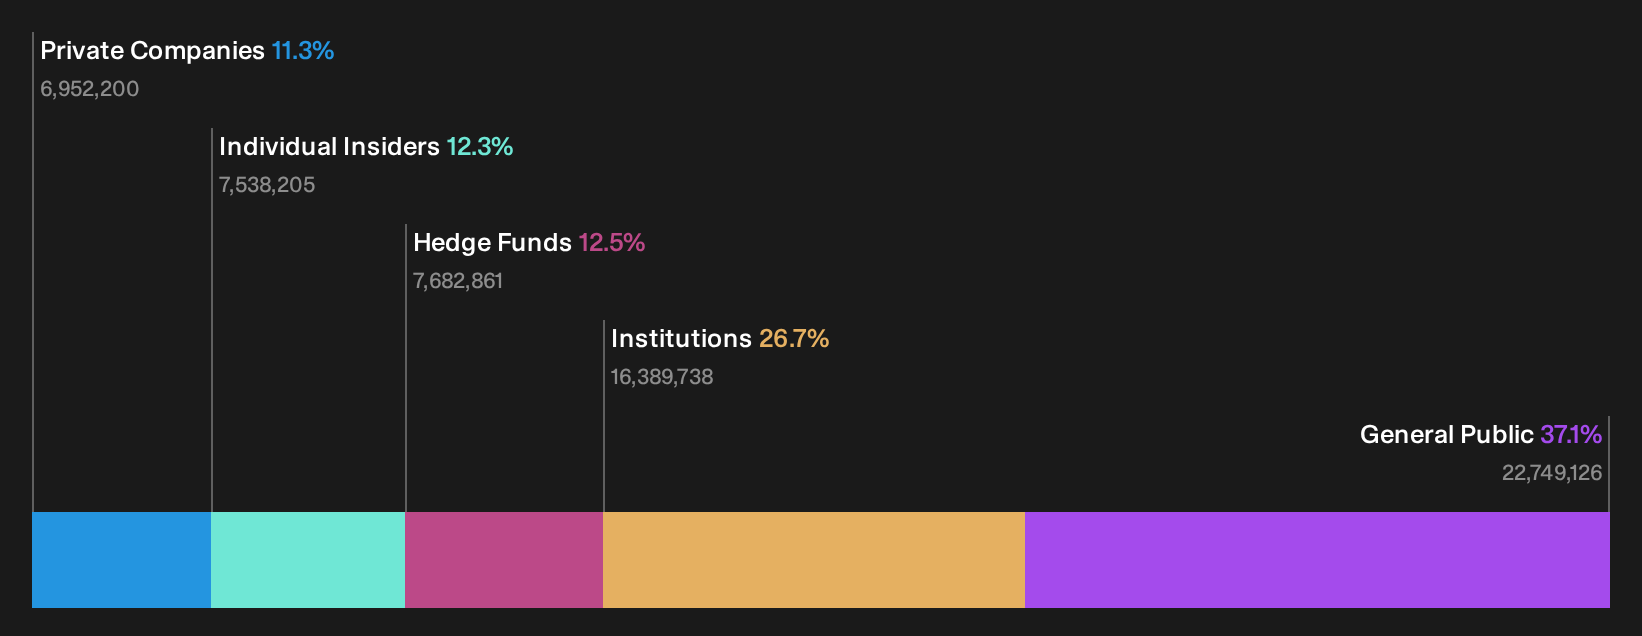
Insider Ownership: 12.3%
Earnings Growth Forecast: 41% p.a.
Mattr Corp. is trading at a 42.6% discount to its estimated fair value, suggesting potential undervaluation for growth-focused investors. The company has reported strong financial performance, with second-quarter revenue rising to C$396.19 million from C$320.96 million year-over-year and net income improving significantly to C$19.82 million from a loss last year. Despite substantial insider selling recently, Mattr's earnings are forecasted to grow 41% annually, outpacing the Canadian market's average growth rate.
- Get an in-depth perspective on Mattr's performance by reading our analyst estimates report here.
- The analysis detailed in our Mattr valuation report hints at an deflated share price compared to its estimated value.
Summing It All Up
- Investigate our full lineup of 52 Fast Growing TSX Companies With High Insider Ownership right here.
- Ready For A Different Approach? Uncover 25 companies that survived and thrived after COVID and have the right ingredients to survive Trump's tariffs.
This article by Simply Wall St is general in nature. We provide commentary based on historical data and analyst forecasts only using an unbiased methodology and our articles are not intended to be financial advice. It does not constitute a recommendation to buy or sell any stock, and does not take account of your objectives, or your financial situation. We aim to bring you long-term focused analysis driven by fundamental data. Note that our analysis may not factor in the latest price-sensitive company announcements or qualitative material. Simply Wall St has no position in any stocks mentioned.The analysis only considers stock directly held by insiders. It does not include indirectly owned stock through other vehicles such as corporate and/or trust entities. All forecast revenue and earnings growth rates quoted are in terms of annualised (per annum) growth rates over 1-3 years.
Have feedback on this article? Concerned about the content? Get in touch with us directly. Alternatively, email editorial-team@simplywallst.com