
Why Sabine Royalty Trust (SBR) Is Back In The Spotlight
Sabine Royalty Trust (SBR) has given investors two key data points to work with: fresh October 2026 production figures and a new monthly cash distribution of $0.355450 per unit.
Against that operational backdrop, Sabine Royalty Trust units trade at $73.87, with a 1-day share price return of 1.61% and a 7-day share price return of 2.10%. The year-to-date share price return of 5.23% and 1-year total shareholder return of 15.38% point to momentum that has been steady rather than explosive. This is supported by multi-year total shareholder returns of 52.09% over three years and 164.92% over five years, which keep income focused investors closely watching each new production and distribution update.
Spot 8 dividend fortresses to compare Sabine Royalty Trust with other income focused plays that pair regular distributions with balance sheets that support them.Fresh production data, a higher monthly payout and a 1-day move of 1.61% put Sabine Royalty Trust in an interesting position. Is this the moment to add units, or to wait for a lower entry price before the next update on value?
Price-to-Earnings of 15.1x: Is it justified?
Sabine Royalty Trust looks expensive on one simple yardstick, with a P/E of 15.1x against 12.2x for the broader US oil and gas group and 9.9x for its closer peer set, even though the latest 12 month earnings slipped by 3% and the most recent year of total return fell short of both the US market and the sector.
The P/E ratio tells you how many dollars investors are paying today for each dollar of reported profit. For a royalty trust like Sabine Royalty Trust, which posts very high net profit margins of 94.7% and reports high quality earnings, a richer multiple can reflect confidence that current distributions and cash flows remain well covered by underlying production and existing contracts.
Those same figures can be read in a different light. Earnings have grown at only 1.3% per year on average over five years and declined over the last 12 months, while both the wider US market and the US oil and gas industry delivered stronger 1 year returns than SBR. A higher P/E in this context points to investors paying up for the trust structure and its very strong reported return on equity, rather than paying for outperformance relative to peers.
The comparison with industry and peer averages is blunt. A 15.1x P/E sits meaningfully above both the 12.2x sector level and the 9.9x peer mark, which suggests the market is attaching a clear premium to Sabine Royalty Trust despite weaker recent earnings momentum and relative share price performance over the last year.
See what the numbers say about this price — find out in our valuation breakdown.
Result: Preferred multiple of 15.1x P/E (OVERVALUED)
Still, the Sabine Royalty Trust story can change quickly if commodity prices weaken or if production volumes tied to its royalty interests begin to soften.
Find out about the key risks to this Sabine Royalty Trust narrative.
Another view on Sabine Royalty Trust’s value
The P/E premium paints Sabine Royalty Trust as pricey, yet the SWS DCF model points in the opposite direction. At a unit price of $73.87 versus an estimated future cash flow value of $127.44, the units are flagged as trading about 42% below that DCF fair value.
That gap suggests the market price might be putting more weight on softer recent earnings and underperformance against the US oil and gas group than on the trust’s high quality earnings and very strong reported return on equity. The real question for you is which signal carries more weight in your own process: the earnings multiple or the cash flow model.
Look into how the SWS DCF model arrives at its fair value.
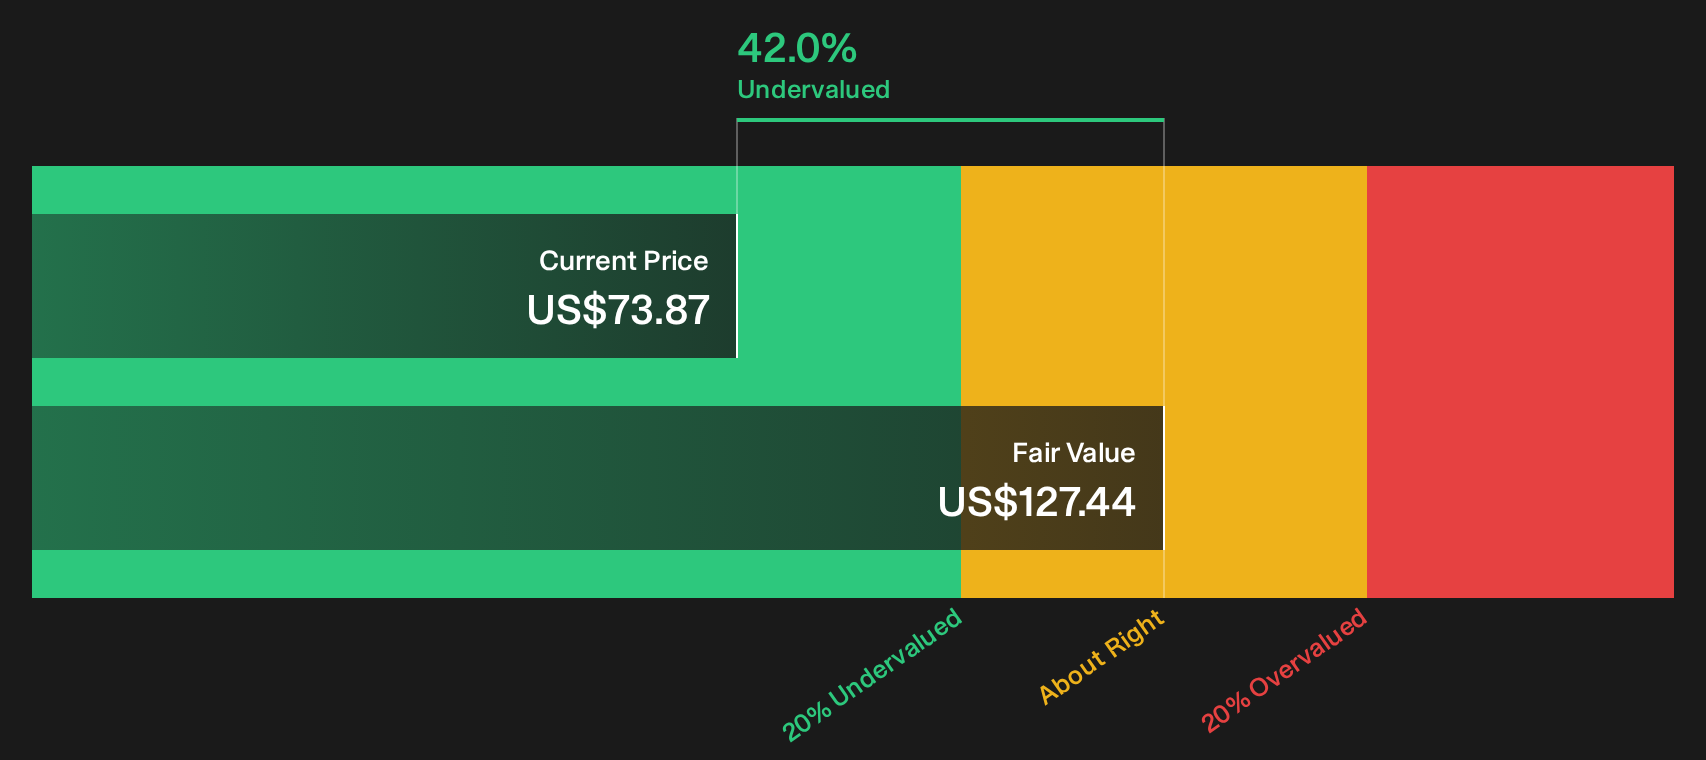
Simply Wall St performs a discounted cash flow (DCF) on every stock in the world every day (check out Sabine Royalty Trust for example). We show the entire calculation in full. You can track the result in your watchlist or portfolio and be alerted when this changes, or use our stock screener to discover 32 high quality undervalued stocks. If you save a screener we even alert you when new companies match - so you never miss a potential opportunity.
Next Steps
Mixed signals around Sabine Royalty Trust can easily pull you in different directions, so move quickly from headline impressions to hard numbers and your own framework for risk and reward by weighing the 1 key reward and 1 important warning sign.
Looking for more investment ideas beyond Sabine Royalty Trust?
If Sabine Royalty Trust has sharpened your focus on income and quality, do not stop here. Broader research across other opportunities can strengthen your overall portfolio.
- Target potential mispricing by scanning a curated list of companies with strong fundamentals through the 32 high quality undervalued stocks.
- Strengthen your income stream by lining up alternatives to SBR in the 8 dividend fortresses.
- Broaden your watchlist with resilient operators that prioritise financial stability using the 32 resilient stocks with low risk scores.
This article by Simply Wall St is general in nature. We provide commentary based on historical data and analyst forecasts only using an unbiased methodology and our articles are not intended to be financial advice. It does not constitute a recommendation to buy or sell any stock, and does not take account of your objectives, or your financial situation. We aim to bring you long-term focused analysis driven by fundamental data. Note that our analysis may not factor in the latest price-sensitive company announcements or qualitative material. Simply Wall St has no position in any stocks mentioned.
Have feedback on this article? Concerned about the content? Get in touch with us directly. Alternatively, email editorial-team@simplywallst.com