
What FB Financial (FBK)'s Revenue Miss Means For Shareholders
- FB Financial reported third quarter 2026 net income of US$60.2 million on revenue of US$174.49 million, with adjusted earnings of US$1.21 per share matching analyst expectations despite a narrower 3.83% net interest margin and a revenue result below consensus.
- The bank paired solid 9.7% annualized loan growth and 11.2% annualized client deposit growth with low 0.04% annualized net charge offs and a US$125 million subordinated debt issue, which supports balance sheet flexibility and ongoing expansion plans.
- We will now look at how FB Financial's revenue shortfall and margin pressure may influence the existing investment narrative around growth.
Scan beyond FB Financial and size up other regional banks balancing margin pressure with loan expansion by reviewing the curated 32 resilient stocks with low risk scores built around resilient balance sheets and disciplined risk profiles.
FB Financial Investment Narrative Recap
To own FB Financial, you need to believe the bank can keep pairing mid to high single digit loan and deposit growth with disciplined credit through cycles of higher funding costs. The third quarter report supports that view on operations, with 9.7% annualized loan growth, 11.2% client deposit growth, and net charge offs at 0.04%.
The key short term swing factor is still net interest margin pressure as deposit costs rise. Margin contracted to 3.83% and quarterly revenue missed expectations, which directly touches the biggest current risk around funding competition and revenue confidence. For now, credit quality and earnings per share held up, so the narrative impact looks contained.
The issuance of US$125 million in subordinated debt is the most relevant recent step alongside these results. That extra layer of capital supports balance sheet flexibility as FB Financial keeps pushing organic loan and deposit expansion through its branch network and newer growth markets.
For you, the question is how that added debt interacts with the main catalysts. Extra capital can support continued hiring of producers, potential acquisitions such as the planned Southern States Bank combination, and ongoing loan growth, while still absorbing credit losses if conditions turn. It also sits opposite the risk that higher funding costs and any future credit issues would pressure returns on that larger capital base.
What The Current FB Financial Consensus Is Asking You To Underwrite
FB Financial's analyst narrative points to revenues of US$848.6 million and earnings of US$297.0 million by 2029, built on 9.2% yearly revenue growth. That earnings path implies an increase of about US$100.5 million from US$196.5 million today.
Uncover how FB Financial's fair value indicates a 31% potential upside to its current price that could narrow quickly.
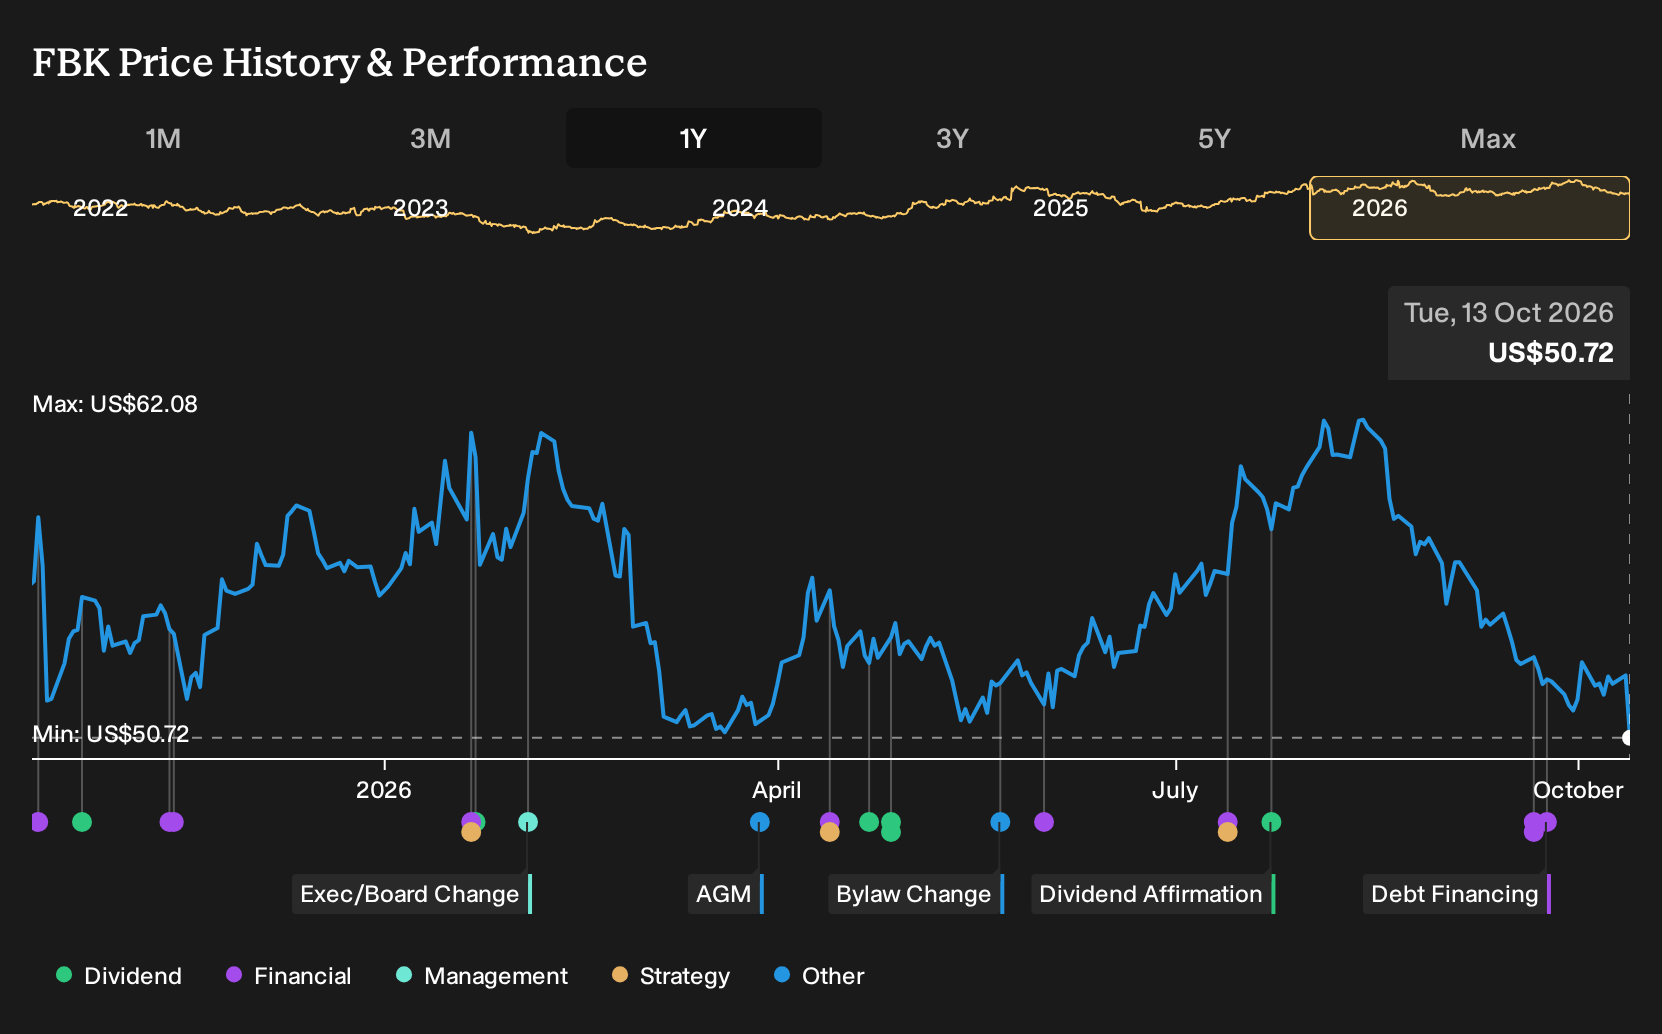
Exploring Other Perspectives
Fair value estimates for FB Financial from 2 private investors in the Simply Wall St Community range from about 66 to just over 103, which is a wide span for the same set of financials. That split sits against ongoing loan and deposit growth plus low net charge offs, so you are seeing sharply different read throughs. You should compare several of these viewpoints directly.
Explore another FB Financial fair value estimate, including one that suggests potential upside of as much as 103% from the current price.
The Verdict Is Yours
Disagree with existing narratives? Extraordinary investment returns rarely come from following the herd, so go with your instincts.
- A great starting point for your FB Financial research is our analysis highlighting 4 key rewards and 1 important warning sign that could impact your investment decision.
- See our latest analysis for FB Financial. The report includes a comprehensive fundamental analysis summarized in a single visual, the Snowflake, making it easy to evaluate FB Financial's overall financial health at a glance.
Looking for more investment ideas beyond FB Financial?
Once you are comfortable with the FB Financial story, it can help to widen the lens and compare it with other businesses that share some of the same strengths you are looking for. The Simply Wall St Screener is a quick way to filter for traits such as balance sheet resilience, income potential, or mispriced quality.
- For income focused investors, scan for companies aiming to pair higher yields with resilient fundamentals using the 8 dividend fortresses.
- If capital preservation and steadier profiles matter most to you, sort for businesses with robust finances and lower risk scores through the 32 resilient stocks with low risk scores.
- When you want to widen the search for lesser known opportunities with strong financial underpinnings, cast a wider net using the 20 high quality undiscovered gems.
This article by Simply Wall St is general in nature. We provide commentary based on historical data and analyst forecasts only using an unbiased methodology and our articles are not intended to be financial advice. It does not constitute a recommendation to buy or sell any stock, and does not take account of your objectives, or your financial situation. We aim to bring you long-term focused analysis driven by fundamental data. Note that our analysis may not factor in the latest price-sensitive company announcements or qualitative material. Simply Wall St has no position in any stocks mentioned.
Have feedback on this article? Concerned about the content? Get in touch with us directly. Alternatively, email editorial-team@simplywallst.com