
Izumi (TSE:8273) Stock Sees Margin Gains While Earnings Keep Drifting
Izumi shareholders came into this earnings print nursing a rough patch. The stock is down about 8% over the past month and about 7% over three months, with a P/E of 11.1x and a 3.29% dividend on offer.
The headline this quarter is profit quality. Net income over the past year is higher on a 3% margin, yet five-year earnings have declined on average. Short-term traders are reacting to the latest quarter. Long-term holders are weighing whether that margin profile can hold over the next few years.
Love Izumi's 3% profit margin but concerned that five-year earnings have been sliding? Check out 22 resilient stocks with low risk scores if you want a list of stocks where resilient fundamentals and lower risk scores line up more cleanly than this quarter's mixed picture.
Q2 2027 Earnings Summary
- Revenue (Q2 2027 vs Q2 2026): ¥158,202 million vs. ¥158,980 million (broadly flat top-line performance)
- Net Income (Excl. Extra Items, Q2 2027 vs Q2 2026): ¥3,898 million vs. ¥4,039 million (slight profit softening year on year)
- Basic EPS (Q2 2027 vs Q2 2026): ¥18.55 per share vs. ¥19.04 per share (modest earnings per share decline)
- Trailing 12-Month Net Profit Margin (Q2 2027 vs prior year TTM): 3% vs. 2.1% (clear margin improvement on a full-year basis)
Prefer clean visuals over scrolling through rows of figures and commentary around Izumi's latest results? See the full picture of the stock's balance sheet strength and structure in an easy-to-scan format in our company report for Izumi.
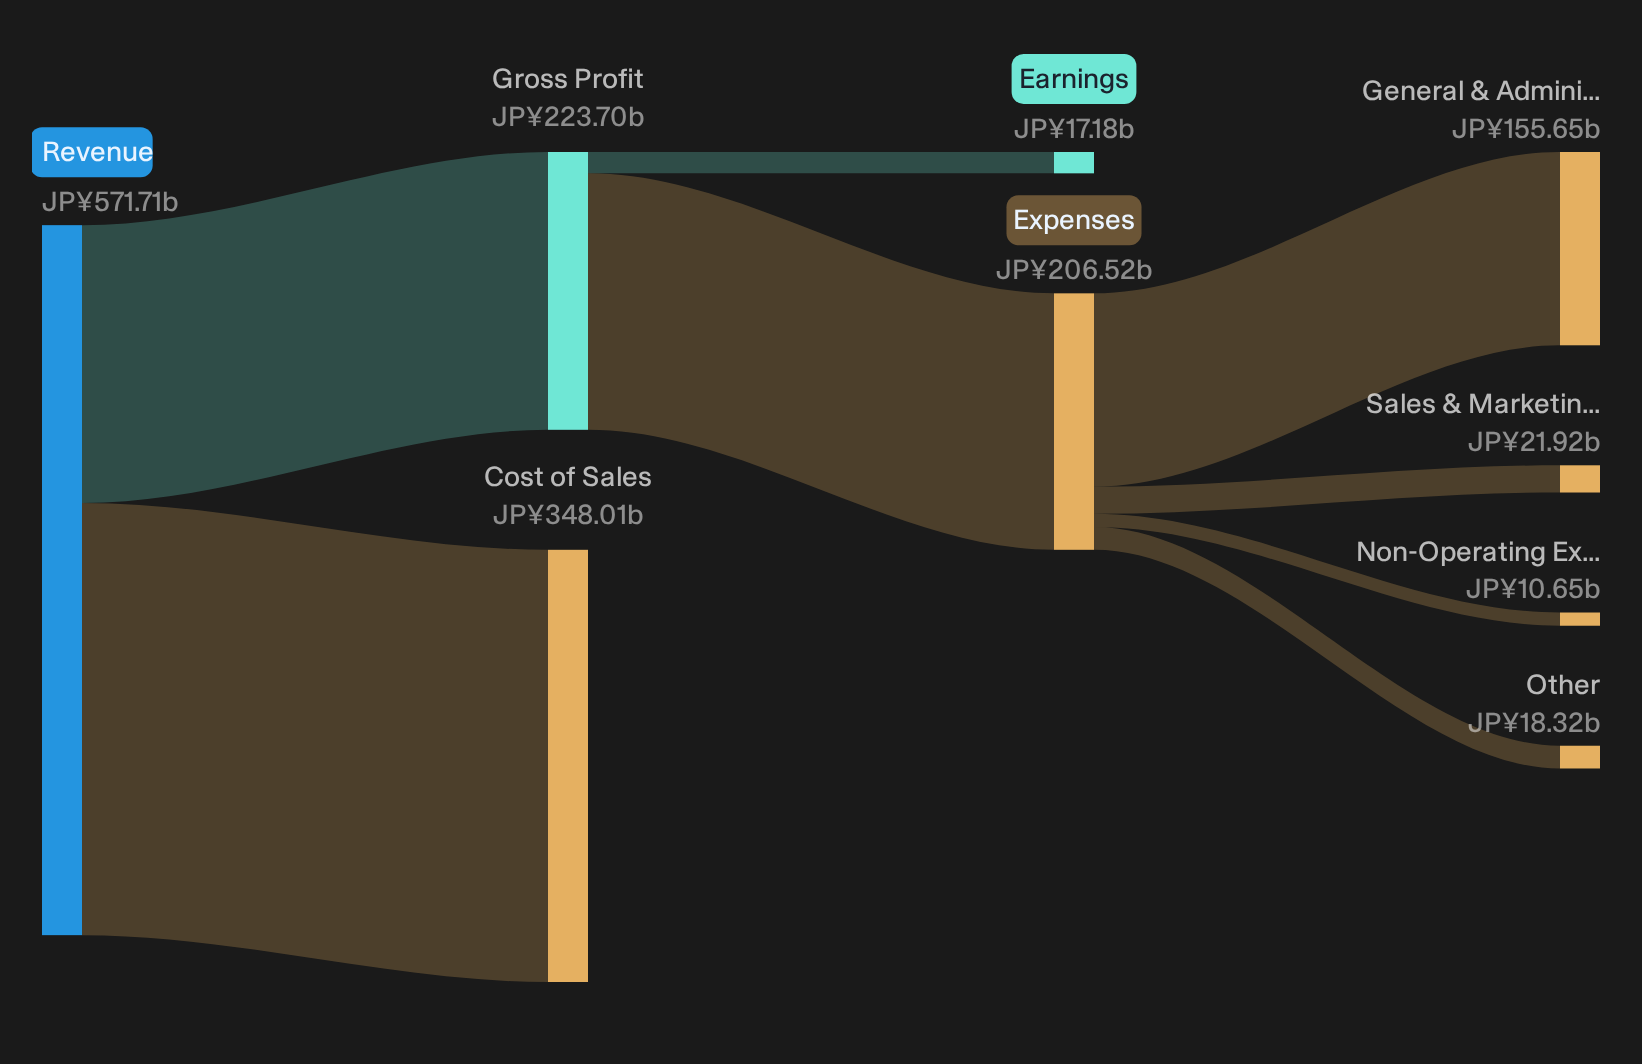
Izumi bullish story leans on sturdier margins
For anyone leaning optimistic on Izumi, the appeal rests on resilience. Revenue is broadly unchanged year on year, which fits the idea of a steady domestic retailer rather than a growth engine. Profit quality looks a little stronger, with the trailing net margin at 3% compared with 2.1% a year earlier. That shift backs the view that exposure to everyday goods and rental-style income can support earnings stability even without top line expansion.
Izumi bear case focuses on earnings drift
There is still ammunition for caution. Management is earning more margin on paper, yet five-year earnings have been sliding on average. Net income excluding extra items softened slightly versus last year and basic EPS edged lower. That pattern hints at a mature retailer working harder for each yen of profit. Recent share returns, which have fallen over 7% across three months, show investors are already treating Izumi as a business where structural and execution risks are front of mind.
Compare Izumi's tighter 3% margin story with what the street is signaling on future upside or downside. See the consensus price target analysis for Izumi to gauge how current analyst targets stack up against the latest earnings mix and the ¥911 share price as of 2026-10-14.
Take Control Of Your Next Move
Izumi's mix of a 3% profit margin, sliding five-year earnings and a recent share price pullback makes timing matter, so register for free with Simply Wall St and add it to your Watchlist to track price against fair value and watch for a setup that fits your plan. After you buy, keep your decisions grounded in facts by managing everything through the Portfolio Command Center that filters routine noise into clear, high impact alerts. For a longer term edge, compare your thinking on Izumi with what other investors are seeing through the Community to spot sentiment shifts early. By surfacing potential catalysts and risks before they hit the headlines, Simply Wall St helps you react faster and stay ahead of the market.
Seeking Alternatives Beyond Izumi?
Fresh ideas move first. By the time momentum is flying, early entry points can be gone. Scan these curated shortlists while they are still under the radar for now and consider them before conditions change.
- Review potential income ideas by scanning hand picked 27 dividend fortresses that blend higher yields with balance sheet strength before the wider market focuses on the same opportunities.
- Explore under the radar quality by reviewing curated 73 high quality undiscovered gems that combine solid fundamentals with stories the wider market has not fully recognized yet.
- Focus on stability with movement by checking carefully filtered list of solid balance sheet and fundamentals stocks (21 results) to help avoid holding weaker businesses when sentiment shifts.
This article by Simply Wall St is general in nature. We provide commentary based on historical data and analyst forecasts only using an unbiased methodology and our articles are not intended to be financial advice. It does not constitute a recommendation to buy or sell any stock, and does not take account of your objectives, or your financial situation. We aim to bring you long-term focused analysis driven by fundamental data. Note that our analysis may not factor in the latest price-sensitive company announcements or qualitative material. Simply Wall St has no position in any stocks mentioned.
Have feedback on this article? Concerned about the content? Get in touch with us directly. Alternatively, email editorial-team@simplywallst.com