
Liberty Latin America (LILA) Stock Could Be Reasonable Despite 33% Slump
Liberty Latin America has delivered mixed results for long term holders, with the stock down 32.7% over the past 5 years, so the key issue now is whether the current share price still lines up with the revenue the business is generating. For anyone looking at Liberty Latin America today, the real puzzle is how much of its sales profile is already reflected in that price.
- The share price decline of 32.7% over 5 years puts the spotlight firmly on whether the revenue base can justify where the stock trades today.
- Liberty Latin America's focus on telecom and broadband services means investor expectations around future customer demand and pricing power can directly shape how its sales support the current valuation.
- Your read on Liberty Latin America is one view; the desks covering it have another. See what analysts think Liberty Latin America's shares could be worth.
The issue now is whether Liberty Latin America's current market value is adequately backed by its sales when measured against the Fair Ratio benchmark.
If you want more context around whether Liberty Latin America's valuation lines up with its sales, it can help to compare that question with other telecom focused companies using solid balance sheet and fundamentals stocks screener (25 results).
Does Liberty Latin America Look Undervalued on Sales?
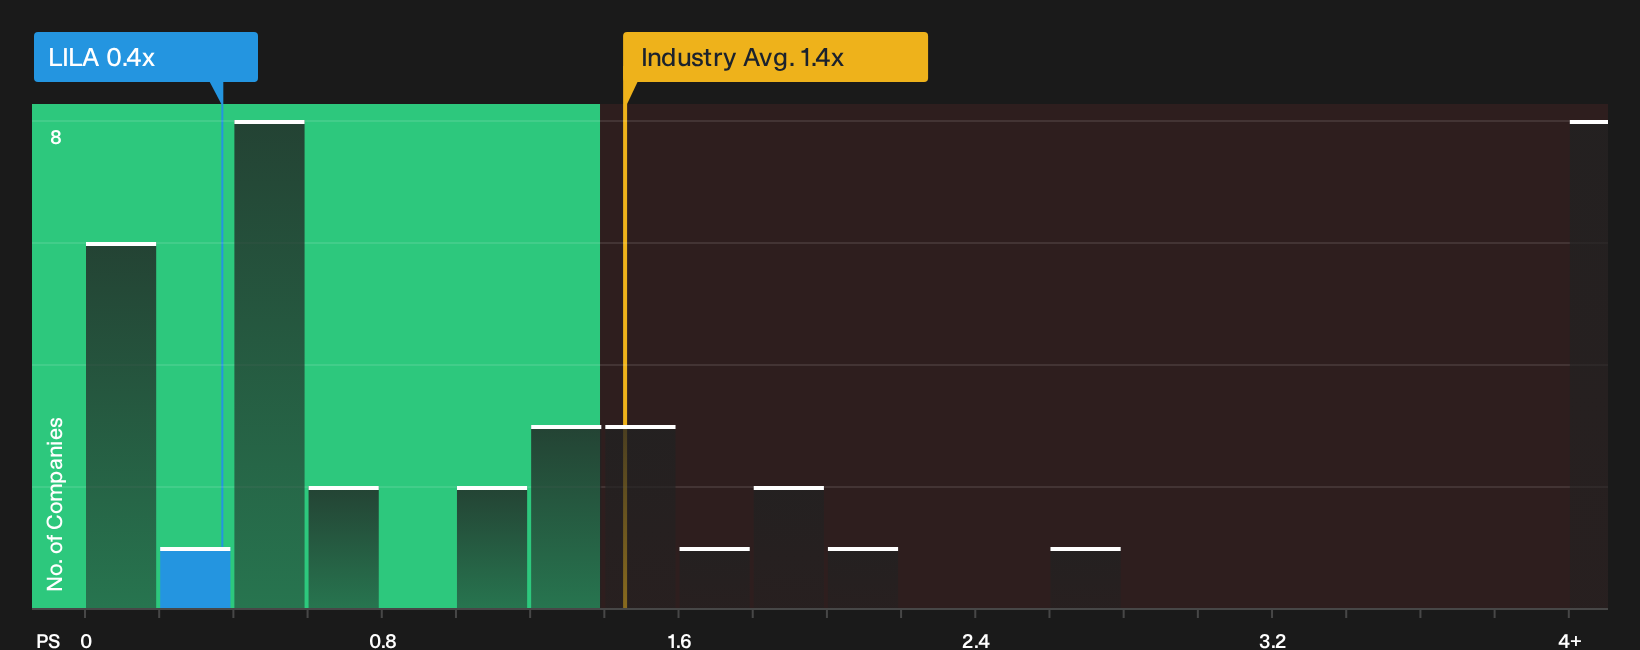
P/S is a useful lens for Liberty Latin America because the business is heavily driven by subscription revenue and top line scale. The stock currently trades on a P/S of 0.4x, which is well below the broader telecom industry average of 1.4x and also below the peer group at 1.8x. That gap suggests the market is paying a much lower price for each dollar of Liberty Latin America’s sales than for many comparable operators.
The Fair Ratio model, which adjusts the benchmark multiple for factors like profitability, reinvestment needs and risk profile, also points to a higher P/S than where Liberty Latin America trades today. That places the current 0.4x reading in undervalued territory on this framework, although the strength and stability of future revenue and margins still matter for how comfortable you feel with that discount. Explore the numbers behind Liberty Latin America's P/S valuation.
The Liberty Latin America Narrative: What Would Justify Today's Price?
Simply Wall St Narratives pick up where the Liberty Latin America valuation question leaves off, because they spell out what kind of future growth, margins and earnings path would need to play out for the stock to end up materially higher or lower than today’s price. Each one links its number to a clear stance on how Liberty Latin America's growth potential, profitability and risk profile could evolve, giving you something concrete to test as fresh information comes through.
Bulls and bears on Liberty Latin America are looking at the same telecom footprint and landing on very different conclusions about how much risk the balance sheet adds.
Bull case: 25% undervalued
"Ongoing operational efficiency initiatives such as labor cost reductions, AI-driven process optimization, and disciplined capital intensity management are expected to drive adjusted OIBDA margin expansion…"
Discover why this Narrative puts Liberty Latin America at 25% undervalued.
Bear case: 19% overvalued
"The company's high leverage and rising interest expense highlighted by Liberty Puerto Rico's unsustainable seven-point-nine times covenant leverage and pending large maturities will severely constrain investment…"
Explore why this Narrative puts Liberty Latin America at 19% overvalued.
For Liberty Latin America, the price tag is only one decision point
Before you stop at the current valuation, it is worth asking who is steering Liberty Latin America, how their pay is structured, and whether those incentives truly line up with shareholder outcomes. See who runs Liberty Latin America and how they are paid.
This article by Simply Wall St is general in nature. We provide commentary based on historical data and analyst forecasts only using an unbiased methodology and our articles are not intended to be financial advice. It does not constitute a recommendation to buy or sell any stock, and does not take account of your objectives, or your financial situation. We aim to bring you long-term focused analysis driven by fundamental data. Note that our analysis may not factor in the latest price-sensitive company announcements or qualitative material. Simply Wall St has no position in any stocks mentioned.
Have feedback on this article? Concerned about the content? Get in touch with us directly. Alternatively, email editorial-team@simplywallst.com