
Weis Markets (WMK) Trades Near $73, Is The Stock Still Priced At A Discount?
Weis Markets (WMK) has drawn investor attention after recent trading left the share price near $73. The supermarket operator runs a regional grocery footprint, with all reported revenue generated in the United States.
The latest move to about $73.11 comes after a modest 1-day share price gain of 0.16%. Over the same period, the 7-day share price return declined 1.22% and the 90-day share price return fell 6.20%, while the year-to-date share price return reached 14.04% and the 5-year total shareholder return came in at 50.45%.
Compare Weis Markets with a hand picked 29 high quality undervalued stocks that share solid cash generation and balance sheet strength, but may be priced more cautiously by the market.
Weis Markets has already handed long term holders a solid run, yet the recent slip from its year to date highs raises a simple issue: Is the bigger opportunity now largely spent or still being priced at a discount?
Preferred P/E of 18.2x: Is it justified?
On simple multiples, Weis Markets looks slightly expensive. The shares trade on a P/E of 18.2x against the US Consumer Retailing industry average of 18.1x and a peer group closer to 12.7x.
The P/E ratio shows how much the market is willing to pay today for each dollar of earnings. For a mature supermarket chain like Weis Markets, that figure often reflects how investors judge the resilience of cash generation, the quality of earnings, and the predictability of day to day grocery demand.
Here, the message is mixed. The stock changes hands at a richer multiple than similar retailers despite earnings that declined 1.8% over the past year and an average 3.9% annual earnings decline over five years. With return on equity at 7.2%, which is described as low, that premium suggests the market is placing more emphasis on stability and the perceived quality of earnings than on clear profit growth.
Compared with the broader Consumer Retailing industry, the P/E gap of 18.2x versus 18.1x is very small. However, the peer comparison at 12.7x points to a much stronger relative valuation. The description that WMK is expensive on both the industry and peer screens indicates investors are paying more than for many alternatives with similar current earnings power, rather than receiving an obvious discount for recent profit pressure.
See what the numbers say about this price — find out in our valuation breakdown.
Result: Price-to-earnings of 18.2x (OVERVALUED).
Still, the investment case for Weis Markets can quickly look different if earnings pressure persists or if regional grocery competition intensifies and chips away at pricing power.
Find out about the key risks to this Weis Markets narrative.
Another view on Weis Markets valuation
The headline multiple presents Weis Markets as expensive, yet our DCF model suggests a different perspective. At a share price of $73.11 and an estimated future cash flow value of $186.54, the SWS DCF model indicates a wide gap. Is this a value case hidden behind weak reported earnings?
Look into how the SWS DCF model arrives at its fair value.
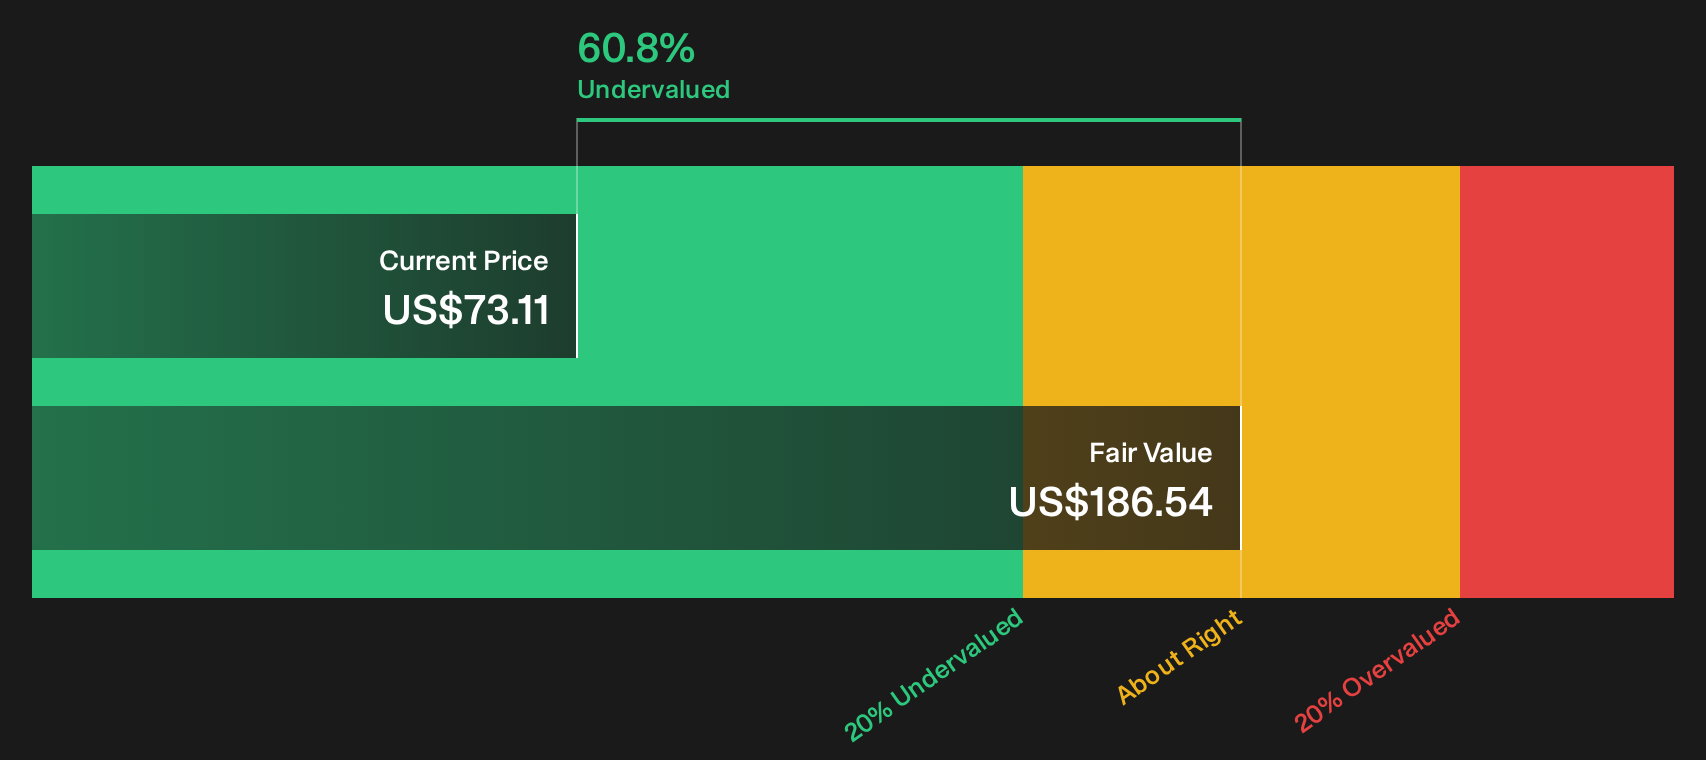
Simply Wall St performs a discounted cash flow (DCF) on every stock in the world every day (check out Weis Markets for example). We show the entire calculation in full. You can track the result in your watchlist or portfolio and be alerted when this changes, or use our stock screener to discover 29 high quality undervalued stocks. If you save a screener we even alert you when new companies match - so you never miss a potential opportunity.
Next Steps
Mixed signals around Weis Markets valuation and quality do not need to leave you stuck on the fence. Step into the data yourself, weigh both the concerns and the bright spots, then pressure test your take against the 2 key rewards and 1 important warning sign.
Looking for more Weis Markets sized investment ideas?
If Weis Markets has sharpened your attention on valuation and quality, do not stop here. Broaden your watchlist now and avoid missing other compelling setups.
- Target resilient compounding potential by scanning a 31 resilient stocks with low risk scores that focuses on businesses with stronger balance sheets and lower overall risk scores.
- Hunt for mispriced quality by reviewing a 20 high quality undiscovered gems that filters for solid fundamentals the wider market may have overlooked.
- Build a steadier income stream by checking a 8 dividend fortresses that concentrates on higher yielding companies with robust underlying financials.
This article by Simply Wall St is general in nature. We provide commentary based on historical data and analyst forecasts only using an unbiased methodology and our articles are not intended to be financial advice. It does not constitute a recommendation to buy or sell any stock, and does not take account of your objectives, or your financial situation. We aim to bring you long-term focused analysis driven by fundamental data. Note that our analysis may not factor in the latest price-sensitive company announcements or qualitative material. Simply Wall St has no position in any stocks mentioned.
Have feedback on this article? Concerned about the content? Get in touch with us directly. Alternatively, email editorial-team@simplywallst.com