
The 10-Year Yield Just Hit Its Highest in Decades: Can ZN Defend 104-100
Oil, Inflation and a Bond Market Testing Its Nerves
Treasury yields hit fresh multi decade highs this week. The 10-year yield touched 5.35% on October 7, the highest since 2002, and settled near 5.24% on Friday. It has climbed roughly 120 basis points this year, and the third quarter was its biggest quarterly rise this century. Oil is a major driver. Brent closed at $104.28 on Thursday after Iran stepped up attacks on tankers near the Strait of Hormuz, with nine vessels reportedly targeted in the past week. Kpler data showed about 9.5 million barrels per day exiting Hormuz, roughly 30% below prewar levels. The G7 has agreed to release up to 100 million barrels from strategic reserves, and Trump said the U.S. would not attack Iran before the November midterms, which helped Brent ease to about $102 on Friday.
Supply and demand for long dated debt is the second sensitivity. The Treasury sold $39 billion of 10-year notes at 5.300% on October 7, the highest auction yield since 2000. Indirect bidders took 80.3% of the sale, well above the recent average of 72.4%, which helped yields pull back from their highs. The 30-year reopening on October 8 then stopped at 5.618%. Global bonds are under the same pressure, with the UK 10-year gilt reaching 5.51%, its highest since 2007.
The Fed adds a third layer. It raised rates 25 basis points to 3.75% to 4.00% on September 16, and the minutes showed most officials expect another hike this year, with no urgency for October. Fed Governor Waller said more hikes may be needed but not necessarily at consecutive meetings. Weak September payrolls of 29,000 have pushed expected hikes from October toward December. Pimco’s Dan Ivascyn warned this week that the 10-year yield could reach 6% if oil and debt concerns persist.
What the Market Has Done
- Since March, ZN has been in a steady downtrend with lower highs and lower lows.
- Throughout this decline, the market has stayed well below the yearly VWAP.
- From the start to the middle of September, selling accelerated, which resulted in a sharper move down to 105-250 (Daily level 2), a daily level from 2023.
- There was some buying response and absorption at that level, but it failed to hold.
- Subsequently, the market continued to sell off into the 104-100 area, a long term level from 2007, which is where price last traded.
What to Expect in the Coming Weeks
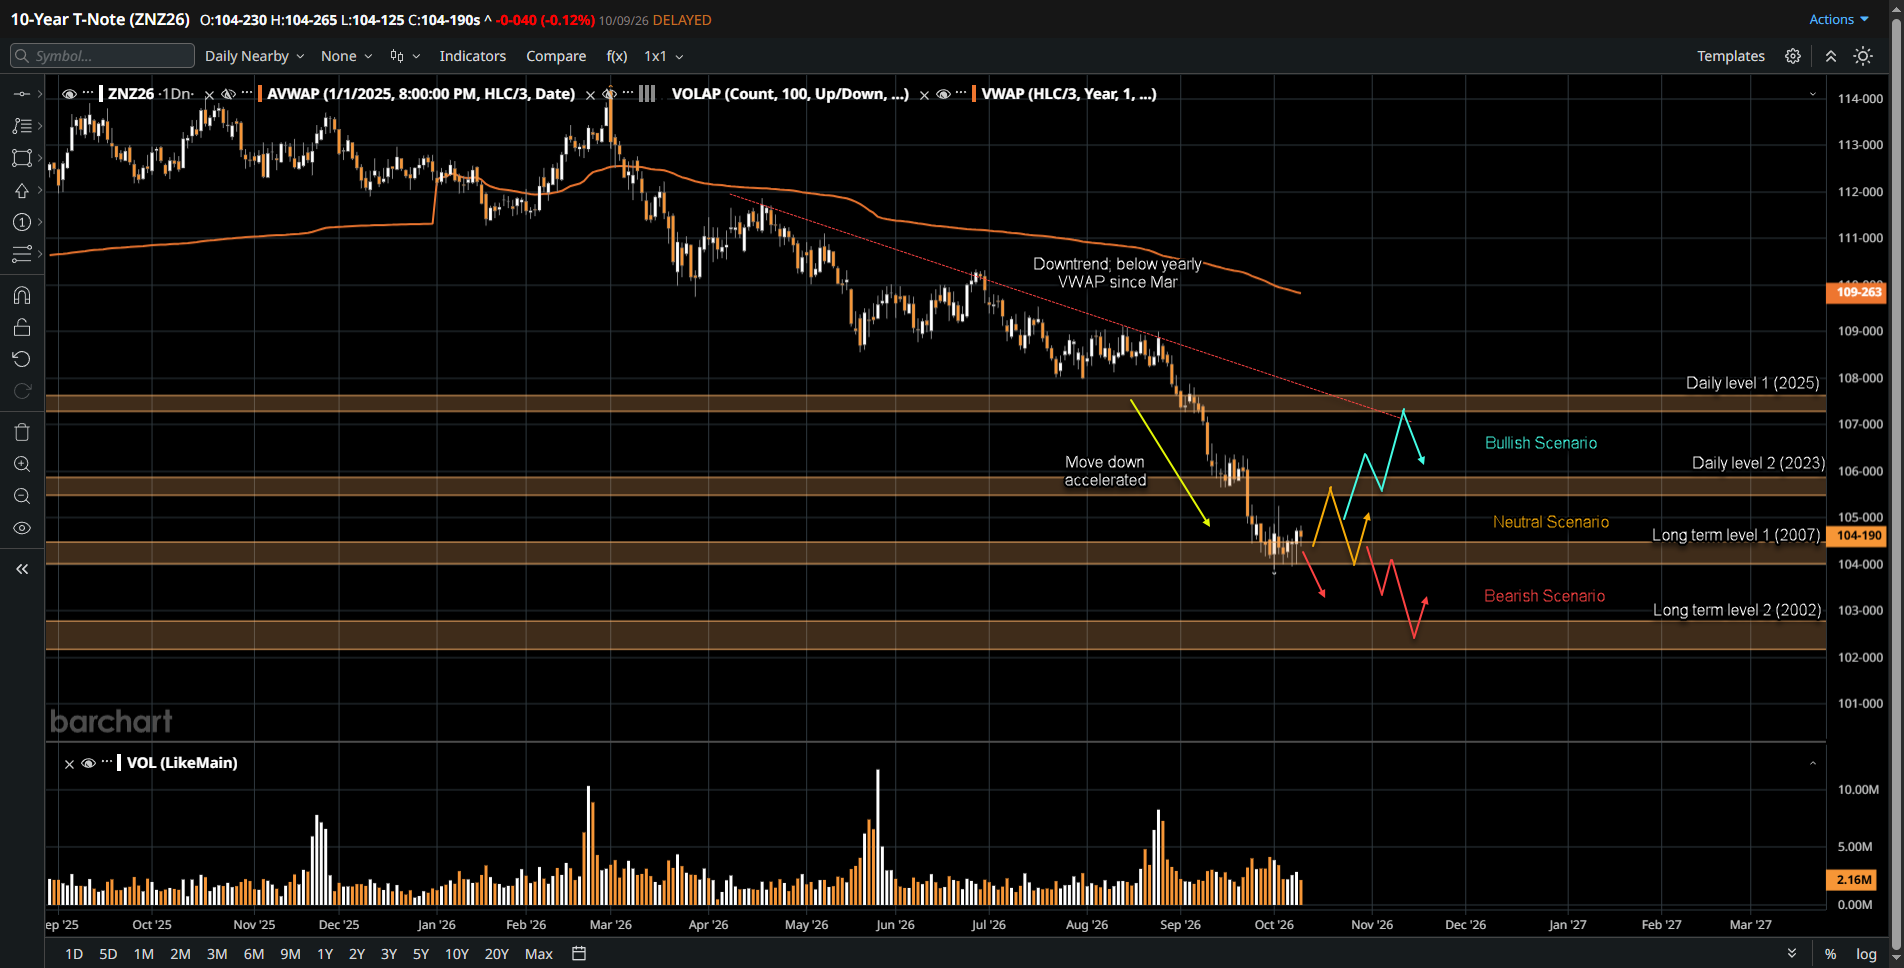
The key level is 104-100 (Long term level 1), a level from 2007. Watch how price behaves around it over the next few weeks to a month.
Bullish Scenario
- If buyers reclaim 105-250 (Daily level 2), expect a move up to 107-200 (Daily level 1), a level from 2025 that is confluent with the descending trendline.
- A possible trigger is a softer than expected core CPI on October 14, paired with easing Hormuz tensions that pull Brent well below $100.
Bearish Scenario
- If buyers cannot defend 104-100, expect a break below and a further move down to 102-100 (Long term level 2), which was also a level from 2002.
- A possible trigger is a hot September CPI combined with renewed tanker attacks that push Brent toward $110, reviving talk of an October hike ahead of the October 27 to 28 Fed meeting.
Neutral Scenario
- Expect two-way rotation between 105-250 (Daily level 2) and 104-100 (Long term level 1) as the market works to reestablish value lower.
- A possible supporting condition for this scenario is an in line CPI report, with the Fed signaling patience for October while oil swings around the $100 area.
Conclusion
ZN is testing a level that has not been tested in over two decades, just as the yield side of the market reaches its highest since 2002. Technically, 104-100 decides whether the market rotates or extends lower. Fundamentally, oil headlines from Hormuz, the CPI report on October 14, and Fed commentary will shape which scenario develops. Watch how price reacts at 104-100 around each of those events. Will this 2007 level provide a floor, or become the next support to give way?
We believe that professional growth is impossible without the truth found in your own data. Our presence on Barchart bridges the gap between complex exchange data and professional execution. Open an Account and access the tools you need to see your performance clearly.
Disclaimer:
This article is provided for informational and educational purposes only and does not constitute financial, investment, or trading advice. The analysis presented reflects the author’s market observations and opinions at the time of writing and is not a recommendation to buy or sell any futures contract, security, or financial instrument. Futures trading involves significant risk and is not suitable for all market participants. Losses may exceed initial margin deposits, and market conditions can change rapidly.
Any scenarios, levels, or market expectations discussed are hypothetical in nature and are intended solely to illustrate potential market behavior. They do not represent actual trading results and should not be interpreted as guarantees of future performance. Past performance, market behavior, or historical price action are not indicative of future outcomes.
Readers are solely responsible for their own trading decisions and risk management. Always conduct independent research, consider your financial situation and risk tolerance, and consult with a qualified financial professional, if necessary, before engaging in futures or derivatives trading.