
Magna International And 2 Other Canadian Dividend Stocks To Own
The IMF is warning that high public debt and rising borrowing costs could test the resilience of major economies, which pushes many investors toward cash flow they can see and touch. Reliable Canadian dividend payers offering yields above 3% with solid coverage and a record of stable, growing payouts can help anchor a portfolio when macro headlines feel noisy. This article highlights three such dividend stocks.
The three stocks highlighted here offer a compelling starting point if you want exposure to dependable dividend powerhouses where yields are above 3% and payouts are backed by visible cash flows. However, if you want the absolute best, these 3 dividend aristocrats stocks are the cream of the crop.
Magna International (TSX:MG)
Overview: Magna International is a global auto parts supplier that designs and builds vehicle systems, including EV battery enclosures, powertrain modules, and ADAS hardware and software for major carmakers.
Operations: Magna generates most of its revenue from Body Exteriors & Structures at about US$16.9b and Power & Vision at roughly US$15.7b, with Seating Systems contributing US$5.9b and Complete Vehicles around US$4.7b.
Market Cap: CA$24.2b
For dividend investors, Magna International matters because its 3%+ yield is tied to real auto programs like EV battery enclosures, multi year powertrain contracts, and ADAS systems that feed recurring cash flow rather than one off projects.
"Magna International is focusing on operational excellence and restructuring actions, which are expected to result in meaningful margin expansion over the next two years."
What happens if one unseen pressure on those future margins and cash flows moves even slightly against the current expectations?
If that pressure worries you, read the full narrative for Magna International to see whether Magna International’s margin story is accelerating or quietly stalling beneath the surface.

Freehold Royalties (TSX:FRU)
Overview: Freehold Royalties collects production based royalties from oil, natural gas and liquids, turning operator output into relatively steady income that supports its >3% dividend.
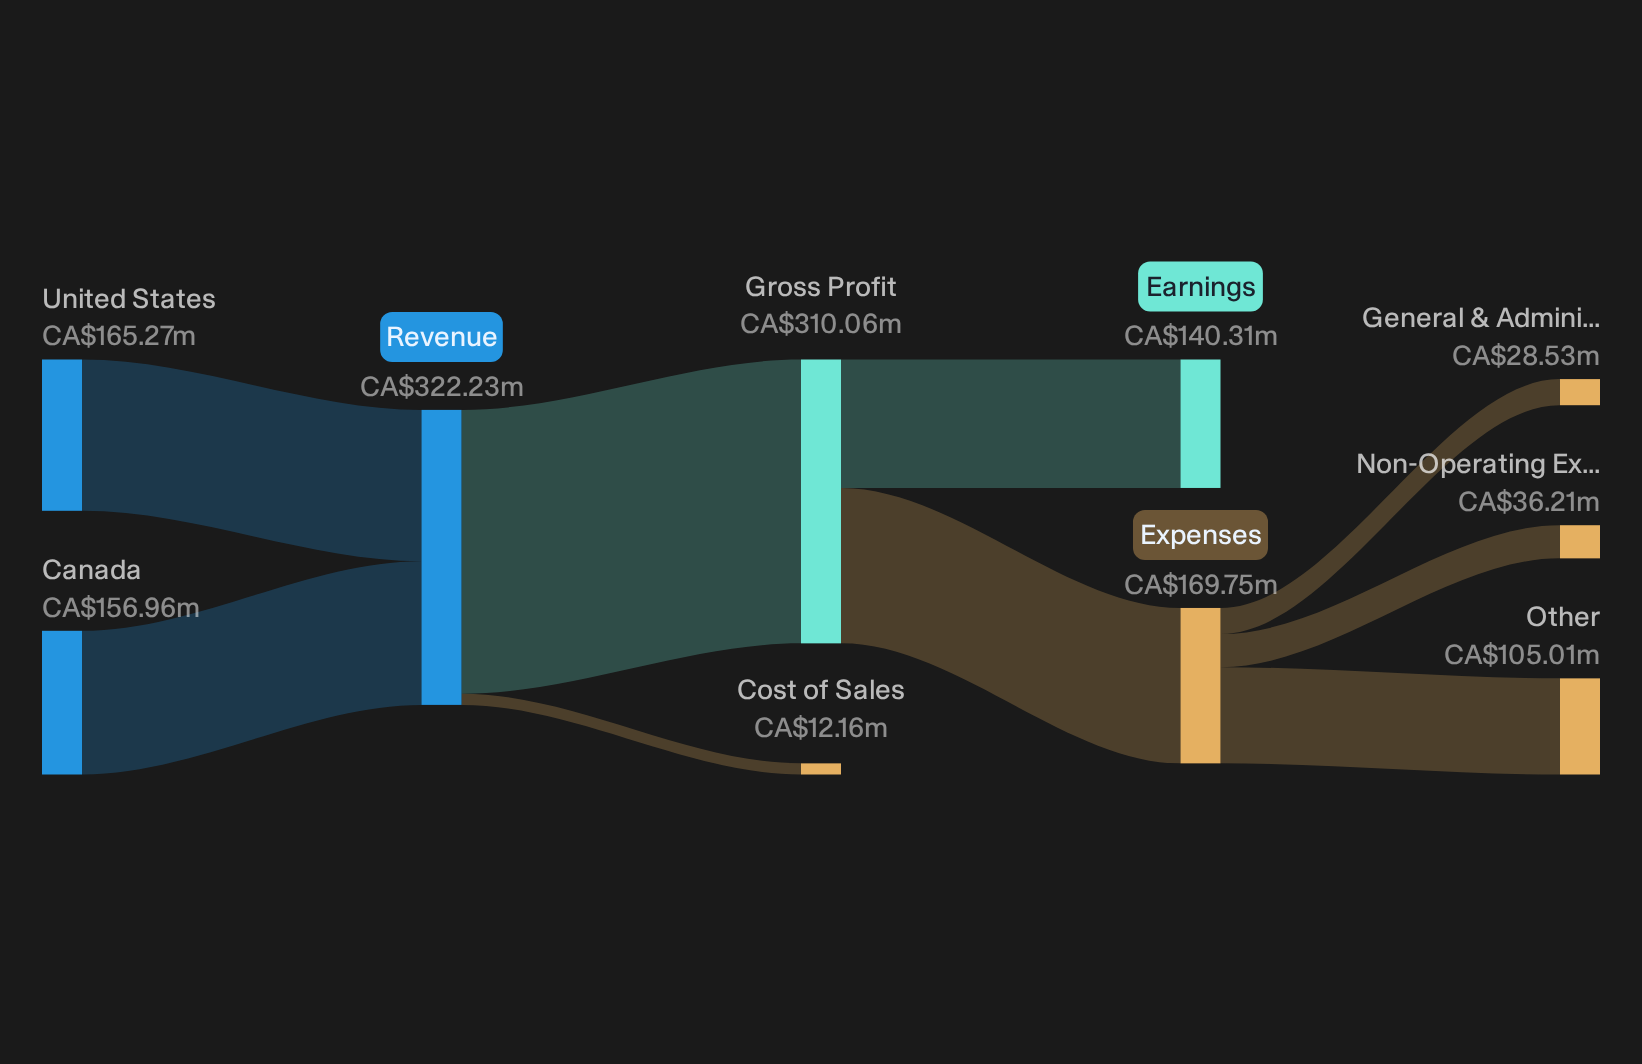
Operations: Freehold Royalties generated CA$322 million from oil and gas exploration and production royalties, split between CA$157 million in Canada and CA$165 million in the United States.
Market Cap: CA$2.8b
Freehold Royalties matters for a dividend powerhouse screen because its royalty checks, not drilling budgets, fund a high headline yield for income focused investors.
"The company does not bear any of the costs of drilling, completion, operation, or environmental rehabilitation on its land. Freehold leases its mineral rights (Mineral Title) or gross overriding royalty (GORR) to third-party operators and receives a 'top-line' share of each barrel of oil or gas produced."
The real test comes if one key assumption about how reliably that royalty stream covers a 6%+ payout starts to shift.
If that coverage starts to look less automatic, the full narrative for Freehold Royalties shows where Freehold Royalties' royalty engine could be accelerating or quietly decoupling from today’s payout.
North West (TSX:NWC)
Overview: North West runs grocery, fuel and everyday retail chains like Northern, NorthMart, Giant Tiger franchise and Cost-U-Less that generate recurring cash flows to support a 3%+ dividend.
Operations: North West earns about CA$1.5b from Canada and roughly CA$1.1b from international markets across its network of stores and distribution businesses.
Market Cap: CA$2.6b
North West links cleanly to the Dividend Powerhouses theme because its community focused food and fuel outlets produce steady cash that supports a 3.06% yield and a recent dividend increase. A P/E below industry averages adds appeal for income seekers, although dividend comfort ultimately hinges on what happens if a single unseen pressure on those cash flows shifts.
If that pressure ever bites harder than expected, consult the North West financial health report to see whether North West’s balance sheet is quietly cushioning or magnifying that risk.

Seeking Fresh Alternatives Before They Fly
Markets move fast and the most interesting opportunities rarely stay under the radar for long. Scan fresh ideas before momentum builds, while it matters, and get in early.
- Spot cash generative businesses early and sort for resilient balance sheets using the list of solid balance sheet and fundamentals (7 results). Miss this and you may only see them after valuations surge.
- Hunt for under followed prospects with healthy fundamentals through the curated 10 high quality undiscovered gems. Wait too long and that quiet mispricing edge could be gone.
- Track accelerating themes in automation by reviewing the hand picked 91 robotics and automation stocks. Sit on the sidelines and the next big move might pass you by.
This article by Simply Wall St is general in nature. We provide commentary based on historical data and analyst forecasts only using an unbiased methodology and our articles are not intended to be financial advice. It does not constitute a recommendation to buy or sell any stock, and does not take account of your objectives, or your financial situation. We aim to bring you long-term focused analysis driven by fundamental data. Note that our analysis may not factor in the latest price-sensitive company announcements or qualitative material. Simply Wall St has no position in any stocks mentioned.
Have feedback on this article? Concerned about the content? Get in touch with us directly. Alternatively, email editorial-team@simplywallst.com