
Frasers Group (LSE:FRAS) As Burberry Move Tests Its 10.7x P E Valuation
Frasers Group (LSE:FRAS) is back in focus after Mike Ashley lifted the retailer's exposure to Burberry to 7.42%, using derivatives to build a larger foothold in the luxury brand.
Recent moves around Burberry land at a time when Frasers Group shares have been trending higher, with a 30 day share price return of 7.38% feeding into a 27.01% year to date gain and a 5 year total shareholder return of 34.87% at a latest share price of £8.51, which signals that momentum has been building rather than fading.
Seize this momentum shift at Frasers Group and scan for other retailers building positions in premium and luxury brands through the hand picked 5 high quality undiscovered gems.Frasers Group now carries Burberry exposure, solid share price gains and rising earnings, so the live question is whether that mix still leaves upside on the table or already prices in the good news.
Preferred P/E of 10.7x for Frasers Group: Is it justified?
On simple earnings terms, Frasers Group looks modestly priced. A P/E of 10.7x at a £8.51 share price sits below both the wider UK market on 16.1x and the UK Specialty Retail peer group on 13.7x. This points to investors paying less for each pound of forecast profit than they do elsewhere in the sector.
P/E is a basic but useful way to frame this retailer. It compares the current share price to earnings per share and gives a quick sense of how much you are paying for the profit stream coming out of a £5,325.9m revenue base and £342.6m of net income. For a business with UK Sports, Premium Lifestyle and international retail operations, that earnings tag matters because it is sensitive to both consumer demand and how well management allocates capital.
The current valuation lines up against a few moving parts. Earnings have grown 23.7% per year over the past 5 years, with a 19.6% gain over the last twelve months, and they are forecast to rise 12.5% per year, slightly ahead of the broader UK market at 11.1%. Net profit margins improved from 5.8% to 6.4%. However, Return on Equity of 14% is still described as low and there are large one off items and a high level of debt affecting the financial picture. Those cross currents can help explain why the market is not attaching a richer multiple, even as the business is trading at what is assessed as good value compared to peers and the estimated fair P/E.
That peer comparison is only part of the story. Frasers Group is assessed as good value not just relative to the industry on 13.7x, but also versus an estimated fair P/E of 16.5x. This is a level the market could move towards if sentiment shifted closer to that benchmark. Against that backdrop, the stock screens as good relative value today even after a strong 1 year total return of 20.88% and a 5 year total shareholder return of 34.87%.
Explore the SWS fair ratio for Frasers Group.
Result: Price-to-earnings of 10.7x (UNDERVALUED)
Still, the Frasers Group story can be knocked off course by pressure on UK consumer spending or by integration risks across its many retail and property segments.
Find out about the key risks to this Frasers Group narrative.
Another view on Frasers Group’s value
Frasers Group screens as inexpensive on its 10.7x P/E, yet the SWS DCF model points to a future cash flow value of £8.08, slightly below the current £8.51 share price. That leans closer to fairly valued than cheap, which raises a simple question: How much margin of safety do you really have here?
Look into how the SWS DCF model arrives at its fair value.
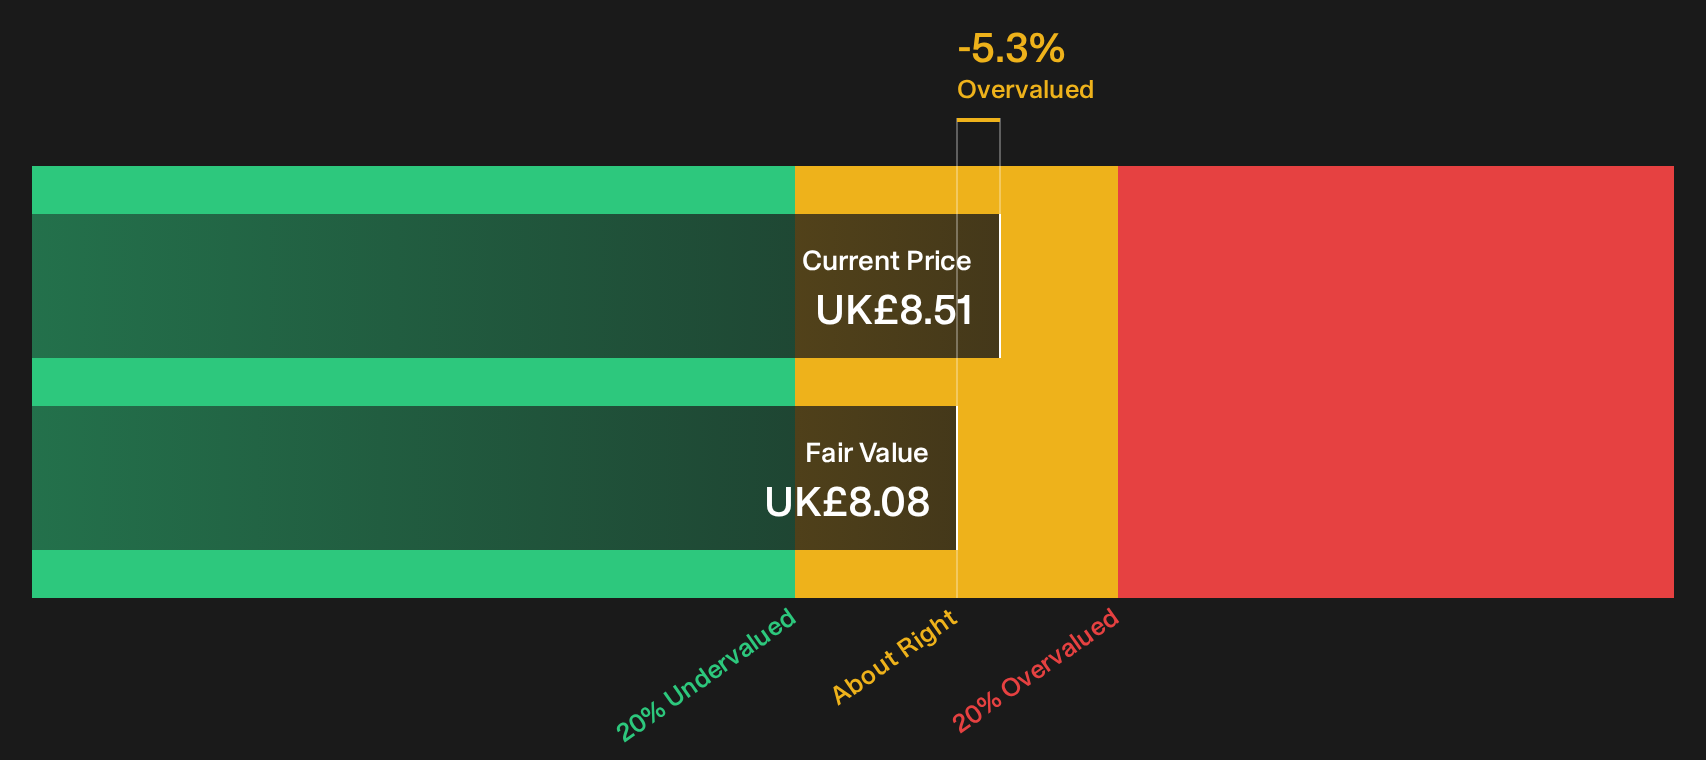
Simply Wall St performs a discounted cash flow (DCF) on every stock in the world every day (check out Frasers Group for example). We show the entire calculation in full. You can track the result in your watchlist or portfolio and be alerted when this changes, or use our stock screener to discover 7 high quality undervalued stocks. If you save a screener we even alert you when new companies match - so you never miss a potential opportunity.
Next Steps
See something different in the Frasers Group story so far and want to move quickly while sentiment is still forming around both risks and rewards? Start by weighing the 4 key rewards and 2 important warning signs.
Looking for more Frasers Group style investment ideas?
If you stop with Frasers Group, you risk missing other opportunities that fit your approach just as well, or sometimes even better, on the numbers.
- Target resilient compounding potential by scanning a 7 high quality undervalued stocks list that filters for quality businesses trading on modest valuations with room for sentiment to catch up.
- Prioritise capital protection first and hunt through a 4 resilient stocks with low risk scores universe built around stronger balance sheets and fewer red flags on core fundamentals.
- Sharpen your watchlist with a 11 elite penny stocks with strong financials set focused on smaller, higher risk companies where any positive shift in expectations can have a big impact.
This article by Simply Wall St is general in nature. We provide commentary based on historical data and analyst forecasts only using an unbiased methodology and our articles are not intended to be financial advice. It does not constitute a recommendation to buy or sell any stock, and does not take account of your objectives, or your financial situation. We aim to bring you long-term focused analysis driven by fundamental data. Note that our analysis may not factor in the latest price-sensitive company announcements or qualitative material. Simply Wall St has no position in any stocks mentioned.
Have feedback on this article? Concerned about the content? Get in touch with us directly. Alternatively, email editorial-team@simplywallst.com