
Marsh & McLennan Companies (MRSH) Could Be 59% Undervalued After East Region Reshuffle
Marsh & McLennan Companies (MRSH) just reshaped part of its US footprint by combining its Eastern operations and appointing Andrew Neary as CEO for the new region, which oversees around 1,400 colleagues.
Set against these management moves, Marsh & McLennan Companies’ recent trading tells a more mixed story, with the share price up over the past week but down year to date, while the 1 year total shareholder return has also declined and the 5 year total shareholder return remains positive. Taken together, this suggests that shorter term momentum has faded compared with the longer run trend.
Spot similar insurance and advisory plays that could be setting up for their own management or earnings catalysts by scanning our hand-picked 20 high quality undiscovered gems aligned with Marsh & McLennan Companies' profile.Marsh & McLennan Companies has already rewarded long term holders, yet the share price has slipped this year while earnings and cash generation remain in focus. Is more of the value story still ahead, or already in the rear mirror as expectations rise?
Preferred P/E of 21.2x: Is it justified for Marsh & McLennan Companies?
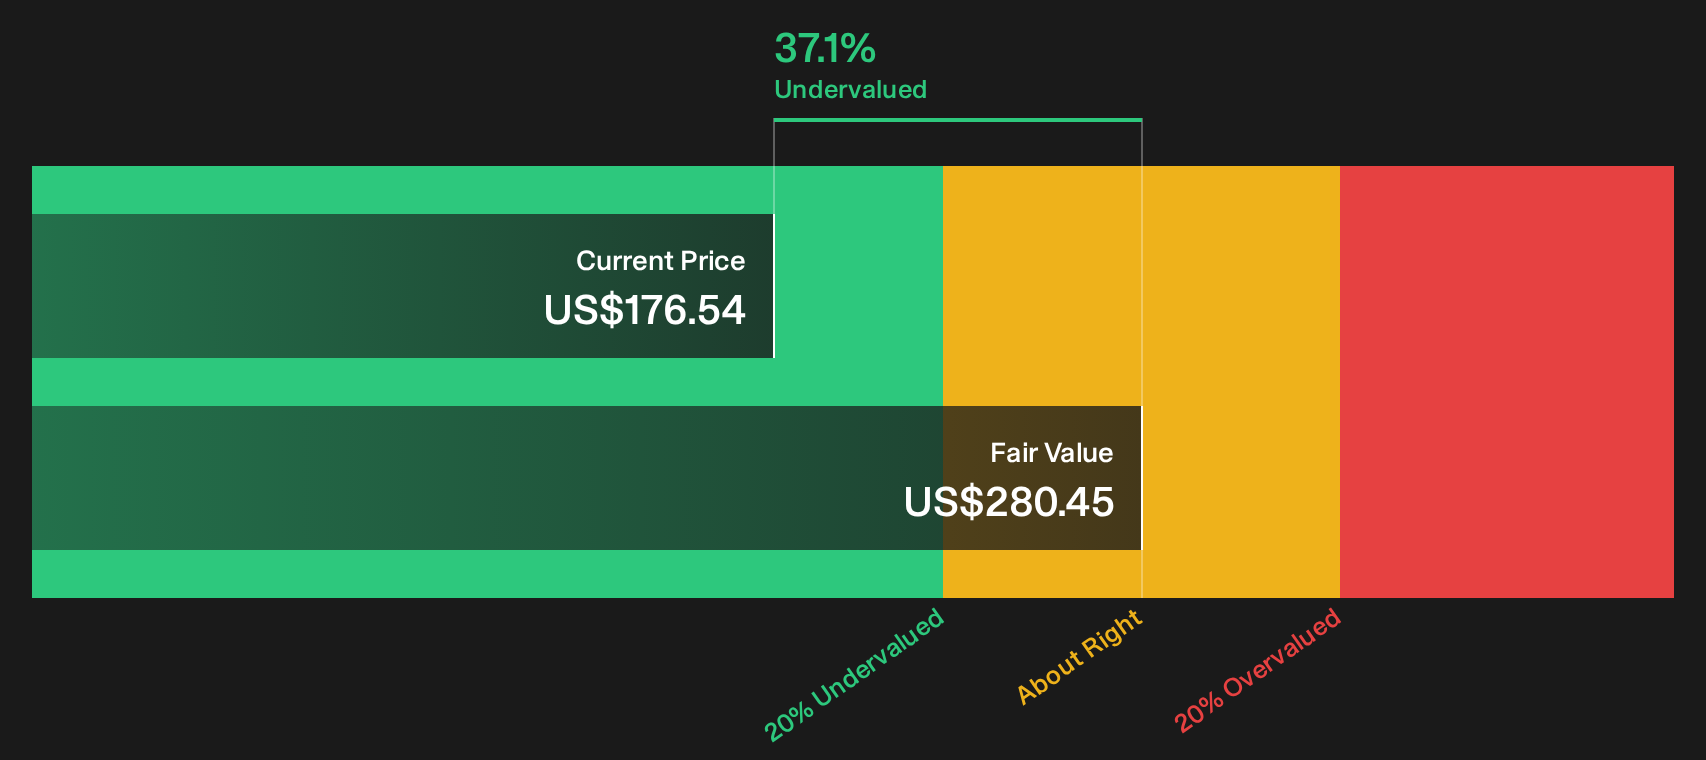
On valuation, the key tension for Marsh & McLennan Companies is that the stock trades at a P/E of 21.2x while our SWS DCF model suggests a fair value of $280.45, which is above the recent close of $176.54. That mix of a premium earnings multiple and a discount to estimated cash flow value is what you need to weigh.
The P/E ratio compares the current share price with earnings per share and is often used for mature, profitable insurers and consultants like Marsh & McLennan Companies. A figure of 21.2x means investors are currently paying a little over twenty times recent earnings, which places a clear price tag on the quality and durability of those profits.
For this business, several factors sit behind that valuation. Earnings are forecast to grow 9.7% per year and revenue is expected to increase 4.2% per year, both slower than the wider US market according to the data provided. Yet the firm shows high quality earnings, a long term earnings growth rate of 8.1% per year over the past 5 years, a return on equity of 26.36% that is described as high, and a 2.24% dividend that is flagged as reliable, all of which can support a higher earnings multiple in investors' minds.
Peer comparisons sharpen the picture. Marsh & McLennan Companies is described as good value relative to a peer P/E average of 22.2x, since its own 21.2x sits slightly lower than that group. Against the broader US Insurance industry average P/E of 11x though, the stock is labelled expensive, which signals that investors are attaching a much richer earnings tag to Marsh & McLennan Companies than to the typical insurer. The fair P/E ratio is estimated at 13x and the company is described as expensive versus that level, which implies the market may be pricing in stronger or safer earnings than the fair ratio suggests could be sustainable over time.
Explore the SWS fair ratio for Marsh & McLennan Companies.
Result: Price-to-earnings of 21.2x (OVERVALUED).
Still, Marsh & McLennan Companies faces clear risks if insurance pricing softens or consulting demand cools. This could pressure earnings quality and challenge that premium P/E.
Find out about the key risks to this Marsh & McLennan Companies narrative.
Another View: SWS DCF fair value for Marsh & McLennan Companies
The earnings multiple paints Marsh & McLennan Companies as expensive, yet the SWS DCF model points the other way. On that cash flow view, fair value sits at $280.45 per share, around 37% above the recent $176.54 price. Which signal do you put more weight on when the next headline hits?
Look into how the SWS DCF model arrives at its fair value.
Simply Wall St performs a discounted cash flow (DCF) on every stock in the world every day (check out Marsh & McLennan Companies for example). We show the entire calculation in full. You can track the result in your watchlist or portfolio and be alerted when this changes, or use our stock screener to discover 29 high quality undervalued stocks. If you save a screener we even alert you when new companies match - so you never miss a potential opportunity.
Next Steps
Sentiment on Marsh & McLennan Companies is finely balanced, with clear risks on one side and genuine upside arguments on the other. Move fast, test the data yourself, and then weigh the 3 key rewards and 2 important warning signs
Looking for more investment ideas beyond Marsh & McLennan Companies?
Do not stop at Marsh & McLennan Companies. Use the same data driven tools to surface fresh opportunities that match your own risk, income, and quality preferences.
- Target potential upside by scanning companies that score well on value and quality through our 29 high quality undervalued stocks.
- Build a steadier income stream by reviewing higher yielding payers in the 8 dividend fortresses.
- Shield your portfolio from shocks by focusing on resilient businesses in the 31 resilient stocks with low risk scores.
This article by Simply Wall St is general in nature. We provide commentary based on historical data and analyst forecasts only using an unbiased methodology and our articles are not intended to be financial advice. It does not constitute a recommendation to buy or sell any stock, and does not take account of your objectives, or your financial situation. We aim to bring you long-term focused analysis driven by fundamental data. Note that our analysis may not factor in the latest price-sensitive company announcements or qualitative material. Simply Wall St has no position in any stocks mentioned.
Have feedback on this article? Concerned about the content? Get in touch with us directly. Alternatively, email editorial-team@simplywallst.com