
Will Net Outflows Change T. Rowe Price's (TROW) Narrative
- T. Rowe Price Group reported September month end assets under management of $1.86 trillion, with client withdrawals of $12.2 billion for the month and $28.3 billion for the third quarter of 2026, including a large defined contribution target date outflow.
- The sizeable net outflows, layered on top of earlier withdrawals and fee pressure, highlight continued business strain for T. Rowe Price Group as it balances active fund headwinds with newer offerings such as ETFs, retirement solutions and alternatives.
- We will now examine how T. Rowe Price Group's sizable third quarter net outflows could influence its broader long term investment narrative.
T. Rowe Price Group Investment Narrative Recap
To own T. Rowe Price Group, you need to believe its retirement franchise, ETFs, SMAs and alternatives can offset pressure from active fund outflows, fee compression and higher costs. The fresh US$28.3b of third quarter 2026 net outflows, on top of prior withdrawals, keeps that tension very live rather than resolving it.
The most important near term catalyst is how upcoming earnings on 29 October 2026 frame flows, pricing and expense guidance. The biggest risk is that elevated outflows and a 38.1 basis point effective fee rate compress revenue while operating expenses still run 4% to 7% above the 2025 cost base.
The recent Federal Energy Regulatory Commission filing is useful context here. It confirms blanket authority for T. Rowe Price funds to acquire certain securities and lists new ETFs such as Securitized Income, Mid Cap Equity Research, Small Cap, Biotech and Dynamic Emerging Market Bonds, alongside closures and fund name changes.
For investors, this speaks directly to catalysts and execution. A broader ETF shelf and refined product set give T. Rowe Price more ways to address client demand for lower fee and retirement friendly vehicles. That opportunity, however, sits against persistent outflows and earnings that some commentators already describe as lagging financial sector norms.
What The Sell Side Is Baking Into The T. Rowe Price Group Story
T. Rowe Price Group's narrative projects US$7.5b revenue and US$2.2b earnings by 2029, which implies a flat top line over the next few years and no change in earnings from about US$2.2b today.
Uncover why T. Rowe Price Group's fair value indicates a 5% potential upside to its current price, which could narrow quickly.
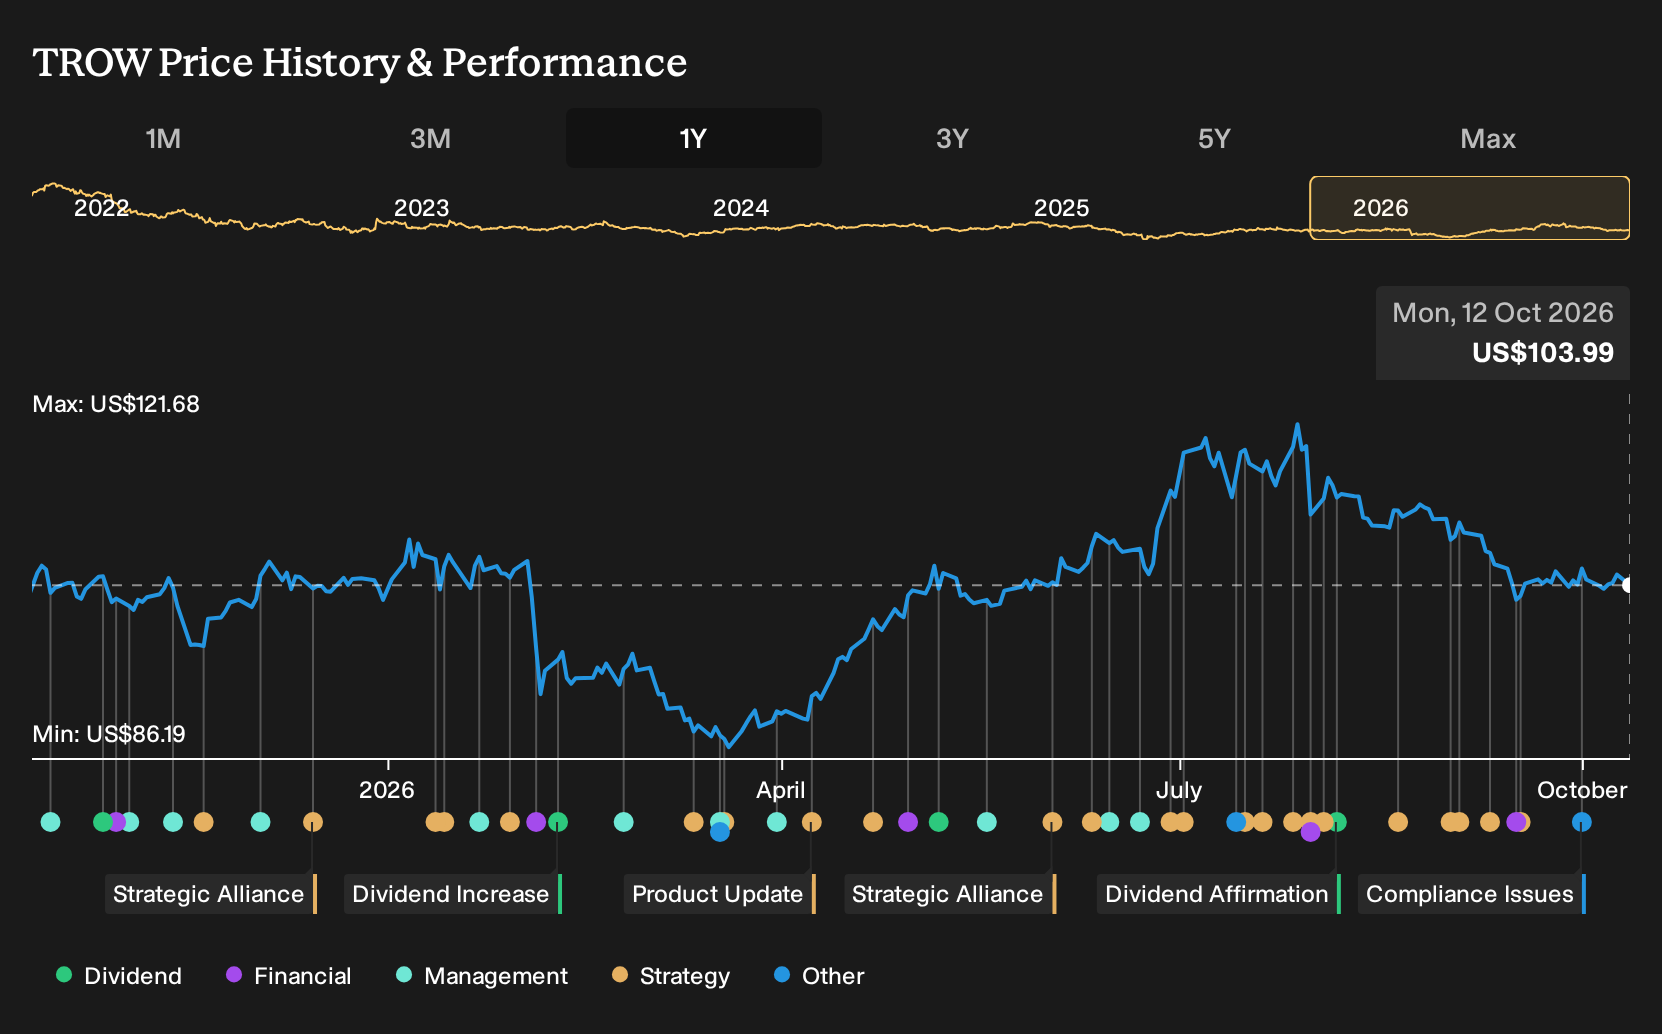
Exploring Other Perspectives
One alternate angle focuses less on product expansion and more on ongoing fee pressure at T. Rowe Price Group. The most cautious analysts were already modeling revenue to edge down about 1.1% a year to around US$7.4b by 2029 and still only see earnings near US$2.2b. That is a clearly more pessimistic story than consensus, and it came before the latest AUM outflows and FERC related ETF updates. Use that gap as a prompt to compare several viewpoints rather than rely on a single narrative.
Explore 4 other T. Rowe Price Group fair value estimates, including one that suggests as much as 11% downside from the current price.
Reach Your Own Conclusion
Don't just follow the ticker. Dig into the data and build a conviction that's truly your own.
- A great starting point for your T. Rowe Price Group research is our analysis highlighting 3 key rewards and 1 important warning sign that could impact your investment decision.
- See our latest analysis for T. Rowe Price Group. The report includes a comprehensive fundamental analysis summarized in a single visual, the Snowflake, making it easy to evaluate T. Rowe Price Group's overall financial health at a glance.
Looking for more investment ideas beyond T. Rowe Price Group?
Once you have a view on T. Rowe Price Group, it can help to compare it with other businesses that fit different checklists on quality, value and resilience. The Simply Wall St Screener groups stocks into focused shortlists so you can quickly test your thesis across a broader universe.
- If you want income that works harder for you, scan through 8 dividend fortresses that combine higher yields with more robust fundamentals than a typical headline yield list.
- If capital preservation sits higher on your agenda right now, start with 31 resilient stocks with low risk scores that screen for steadier balance sheets and lower overall risk scores.
- If you are hunting for overlooked opportunities with solid underpinnings, refine your watchlist using 20 high quality undiscovered gems that pair strong financials with less widely followed stories.
This article by Simply Wall St is general in nature. We provide commentary based on historical data and analyst forecasts only using an unbiased methodology and our articles are not intended to be financial advice. It does not constitute a recommendation to buy or sell any stock, and does not take account of your objectives, or your financial situation. We aim to bring you long-term focused analysis driven by fundamental data. Note that our analysis may not factor in the latest price-sensitive company announcements or qualitative material. Simply Wall St has no position in any stocks mentioned.
Have feedback on this article? Concerned about the content? Get in touch with us directly. Alternatively, email editorial-team@simplywallst.com