
1929 Fears Are Back for Investors — And They're Half-Right. 5 Early Warning Signs I'm Watching for the Stock Market Now.
The Federal Reserve raised interest rates to 3.75% to 4% on Sept. 16, its first hike since July 2023. Around the same time, the 10-year Treasury yield climbed past 5% and headed toward a 24-year high.
But Wall Street hardly blinked, and the S&P 500 ($SPX) closed at a record on Friday, Oct. 9.
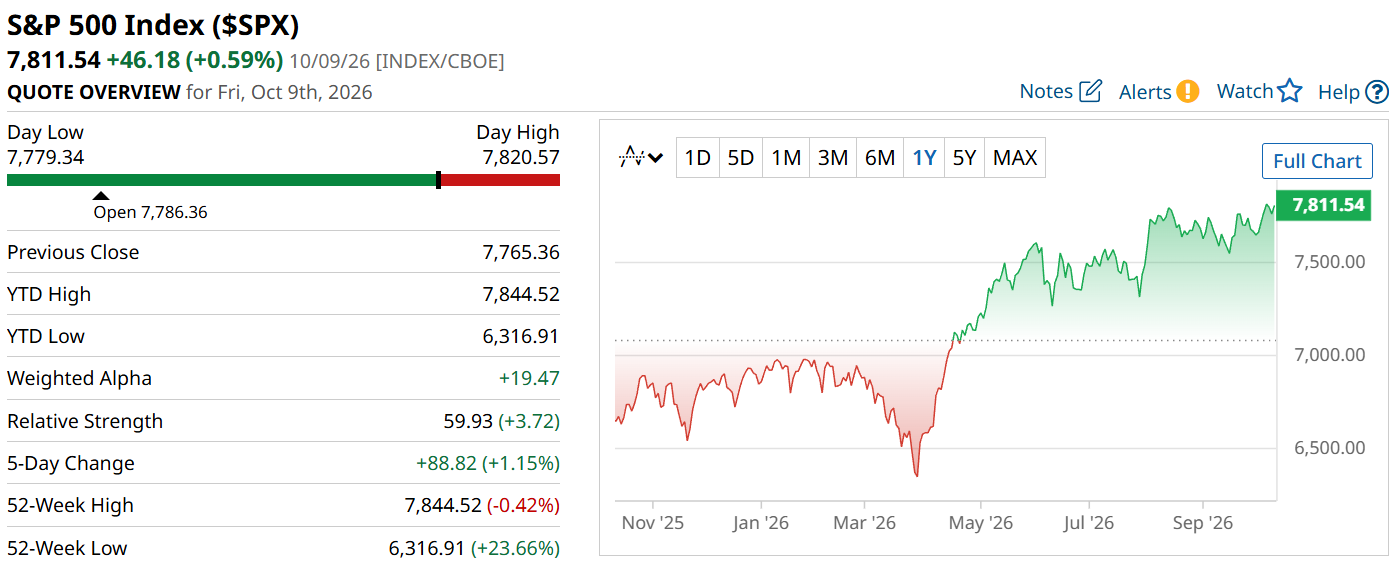
That record is making plenty of folks wonder whether history is about to repeat itself, and I get it – because a pricey market, a pile of borrowed money, and a central bank tapping the brakes sound an awful lot like 1929. Still, I think the comparison is only half right, and the wrong half is the one that matters most, but I'll get into that later.
For now, let's rewind to the year everybody keeps bringing up.
What Caused the 1929 Stock Market Crash? Fed Hikes and 10% Margin Debt
The 1929 story begins with a boom: the Dow Jones Industrial Average ($DOWI) climbed from 63 in August 1921 to 381 in September 1929, a roughly sixfold gain for investors in eight years.
A large chunk of the buying was done on credit, with a typical buyer putting down just 10% and borrowing the other 90% from a broker. This is a very risky way to own stocks because a 10% drop wipes out everything the buyer put in, and the broker then dumps the shares to pay off the loan.
Now, the Fed went after the stock market on purpose, and I find that more telling than the size of the actual hike. Officials believed speculation was soaking up liquidity, so the Board started by asking regional Fed banks to turn away any bank funding for stock bets. But that didn't work, and in August 1929 the New York Fed raised its discount rate to 6%; this is what the Fed charges banks to borrow from it.
A 6% rate may sound ordinary today, but it was brutal in its day. That is because inflation was roughly flat in 1929, so borrowers had to pay the full weight of that 6%. From there, the Dow peaked at 381.17 on Sept. 3, then lost nearly 13% on Oct. 28 and almost another 12% on Oct. 29. And the slide didn't end until July 1932, when the index sat 89% below its peak at 41.22.
Surprisingly, the crash damaged the economy far less than its reputation suggests. The New York Fed jumped in right away with bond purchases, easy loans to the banks, and a rate cut. That kept the big New York banks open. But the real disaster came later, when wave after wave of banks failed in an era of no deposit insurance.
So my takeaway from 1929 is that several factors all went wrong together. The rate hike started the trouble, heavy borrowing made the fall much worse, and the lack of a safety net for banks turned a market crash into the Great Depression.
Now, let's see how that compares with 2026.
Is the Stock Market Overvalued? CAPE Ratio and Margin Debt vs. 1929
First, a quick word on price: the Shiller Cyclically Adjusted Price-to-Earnings (CAPE) ratio stands at 41.87, making today's market look more stretched than the other. Basically, this metric compares what stocks cost with what companies earned on average over the past 10 years. The long-run average is 17.42, and the July 1929 reading was about 31, meaning investors today are paying roughly 35% more for each $1 of those profits than buyers did on the eve of the 1929 crash.
As for borrowing, it is back in a big way, with margin debt reaching $1.45 trillion in August. Investors borrow this money from brokers (usually) to buy stocks, and the figure is up 37.2% from a year earlier and just below the $1.50 trillion record set in June. That said, buyers usually get to borrow 50% of the stock prices today, far from the 10% needed in 1929, so I think the kind of forced selling we saw back then is less likely.
Still, I see the pace as a yellow flag, because margin debt has grown 140% since the end of 2022 while the S&P 500 roughly doubled.
Another thing that nags at me is how few stocks are actually driving this rally. I mean, the 10 largest companies by market cap make up about 37% of the S&P 500. For example, when the index closed at a record on Oct. 9, fewer than 50% of its stocks were trading above their 200-day moving average.
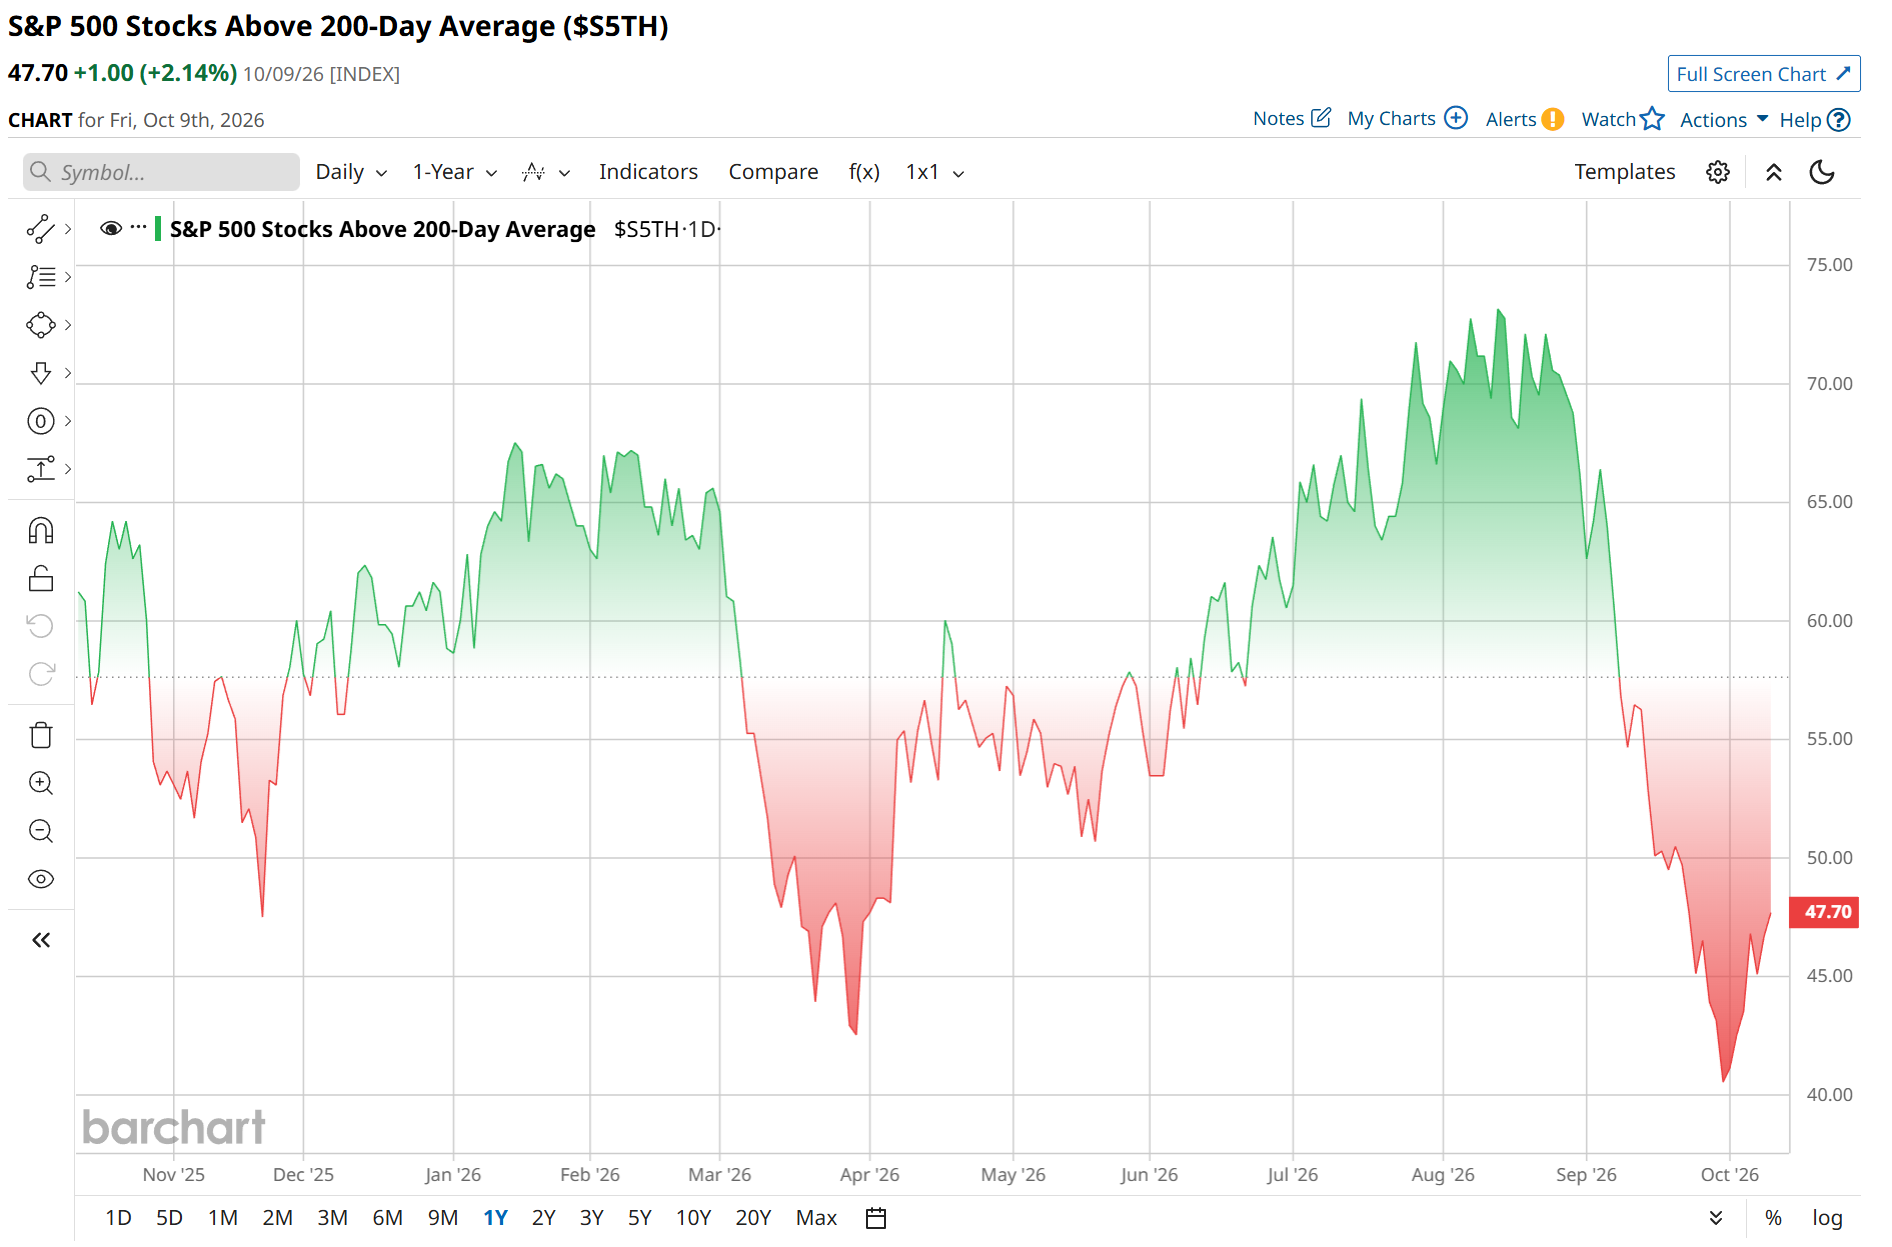
So on price, borrowing, and how narrow the rally is, I can see the connection to 1929.
But the rate hike is where the comparison falls apart for me, because core Personal Consumption Expenditures (PCE) inflation is running at 3.0%. Basically, this is the Fed's favorite price gauge, and since the Fed's rate sits near 3.9%, money costs less than 1%- once inflation is taken out of the equation.
Even Fed Chair Kevin Warsh has said he'd be hard-pressed to call conditions tight. Contrast that with the Fed of 1929, when it was charging about 6% above inflation. So to me, this Fed has barely tapped the brake.
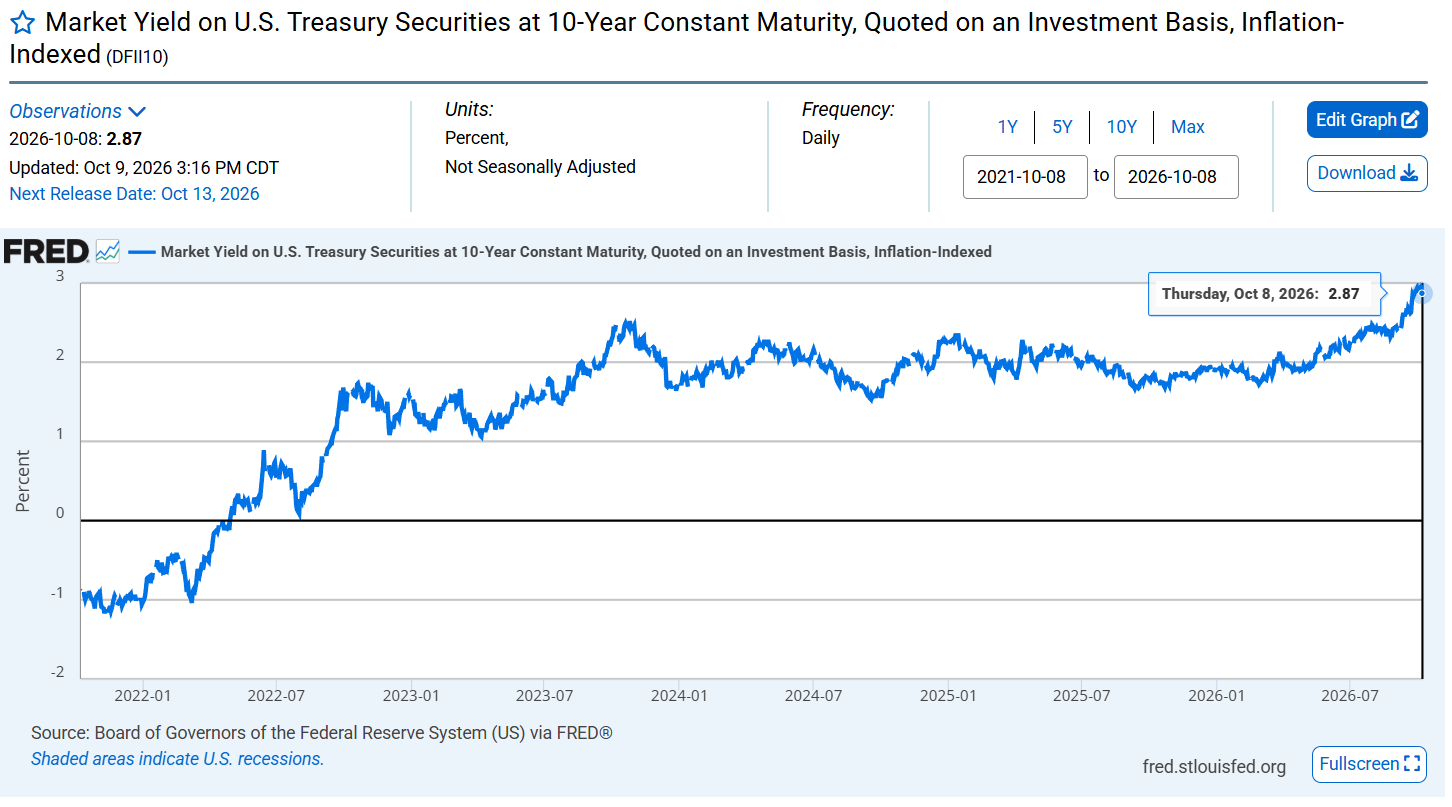
But money is still getting more expensive in another corner of the market, and I think the real squeeze today is coming from bonds.
For example, the 10-year Treasury yield after inflation has jumped from about 2.4% in early September 2026 to 2.95%. I see this as lenders wanting more because of the oil shock from the war in Iran and heavy federal borrowing. That means when a safe government bond pays this much, investors get pickier about what stocks are worth. The tricky part is that the Fed doesn't get to set this rate, so even a pause in hikes may not bring it down.
I know all of this sounds pretty gloomy, so here's the good news.
Profits Growing Near 30% and a Banking Safety Net Set Today Apart
The good news begins with profits. FactSet Research Systems (FDS) expects S&P 500 third-quarter earnings to grow 29.5% from 2025, marking three quarters in a row above 25%. FactSet, a research firm that collects Wall Street forecasts, raised its estimate to 26.7% on June 30, even though analysts usually trim the numbers as a quarter goes on.
Now, I have to be fair, because profits were rising in 1929 too. Earnings for companies in the Dow grew about 33% between 1926 and 1929, and nobody was spared, so strong profits aren't a bulletproof vest.
Still, profits do change the price tag, and the S&P 500’s forward P/E is 19.2. This is today's price divided by the expected profits over the next 12 months, and it actually sits below the five-year average of 19.8.
So we have the CAPE, which looks high, and a forward P/E that looks fine because today's profits run at more than twice the 10-year average. So I keep asking whether profits can stay this high, and personally, I see some of it fading. Chipmakers are expected to grow earnings 126%, energy companies are getting a big lift from the oil shock, and both businesses have a history of booms followed by busts, as the PHLX Semiconductor Index ($SOX) shows.
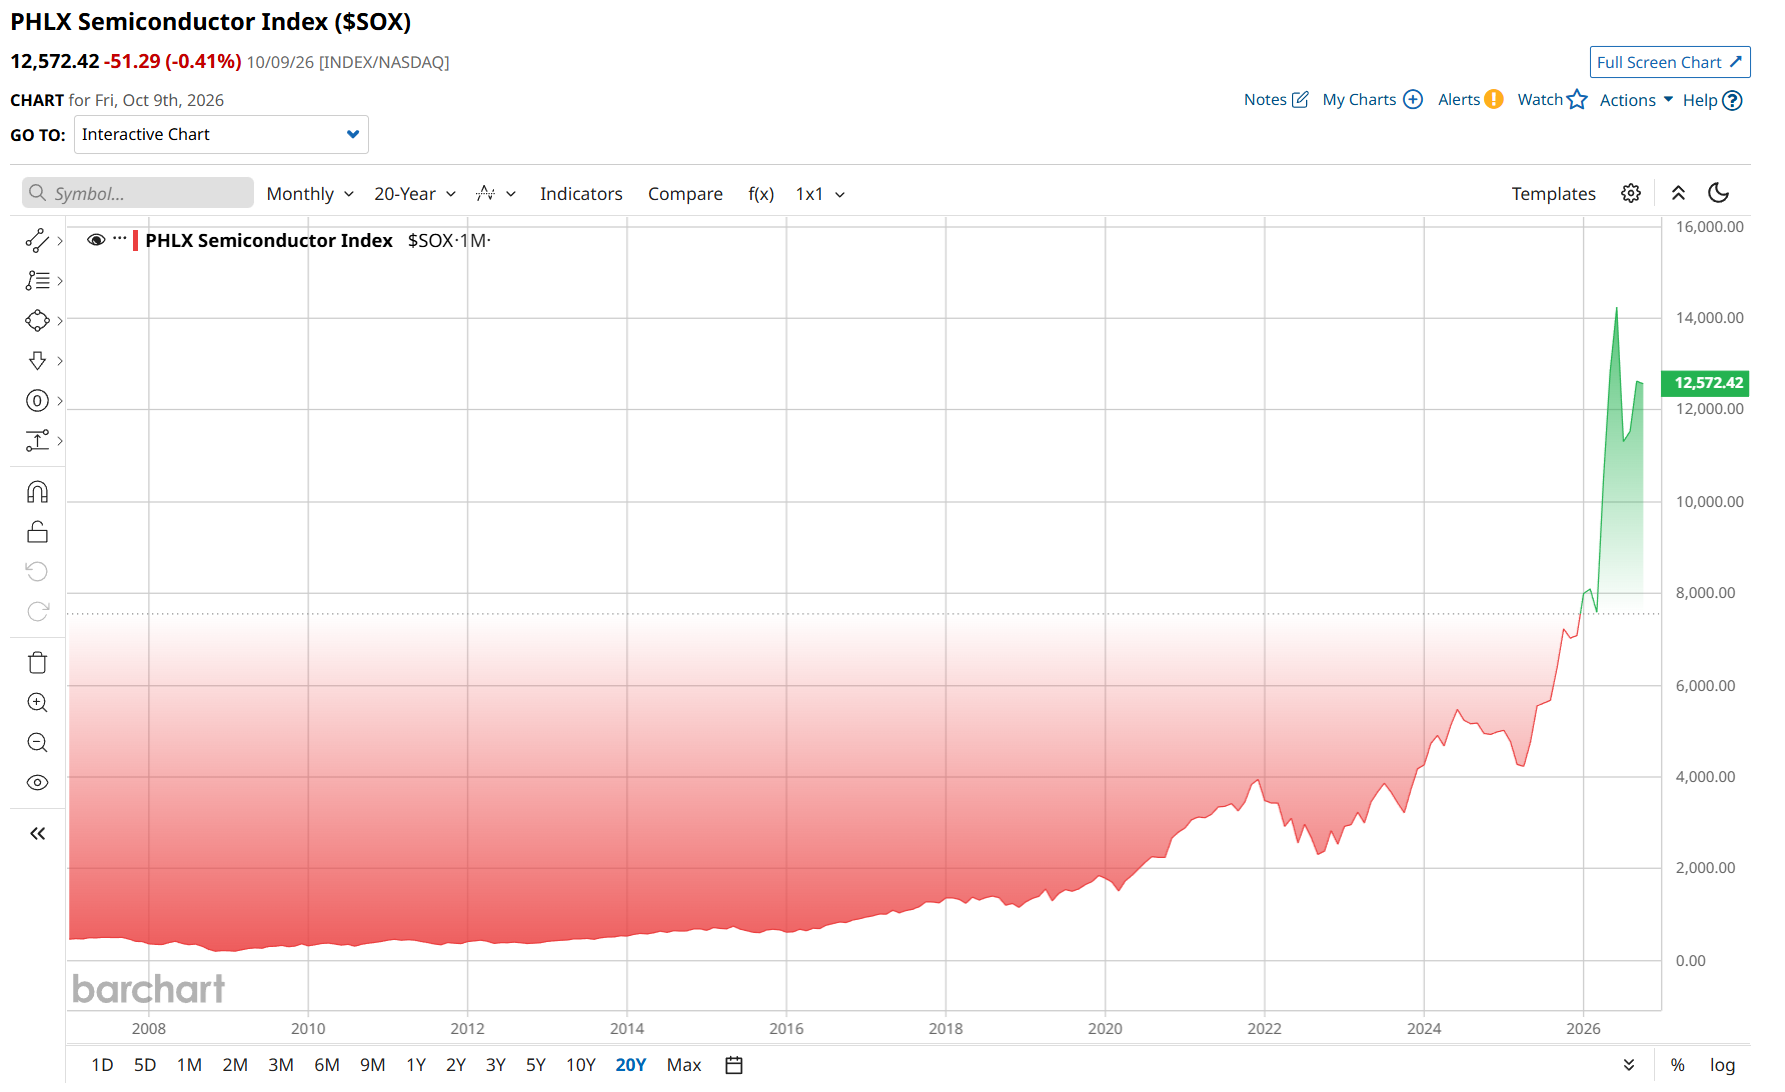
On top of that, a forward P/E of 19 means companies earn about $5.21 a year for every $100 in their stock price, and the 10-year Treasury now pays nearly the same with far less risk, which means growth has to do all the heavy lifting.
Still, the part that gives me the most comfort is the safety net, which I think is the biggest change since 1929. Back then, the dollar ($DXY) was tied to gold, so the Fed couldn't freely pump money into the system when banks got into trouble, and savers often lost money when a bank failed. But today, deposits are insured, and the Fed said again in September that it will keep the banking system well supplied with cash.
I do have a caveat, though, since inflation is running at 3% against the Fed's 2% goal. Personally, I think this gives the Fed less room to cut rates in a selloff than it did in 2008 or 2020. In other words, the Fed can lend to keep markets moving, but I would not count on it to rescue share prices.
Now, I'll be the first to admit that all of this is speculation, and it's just where I see the market today. I'm also not doing anything drastic, like going “all cash.”
But I'm watching a few signs.
5 Warning Signs That Would Change My View on the Stock Market
I keep five markers on my screen, and each one sits just outside its recent range, so a break would tell me something new.
First up, I look at #1, credit – because lending committees tend to smell trouble sooner than shareholders. The high-yield spread is 3.15%, up from 2.63% in late August.
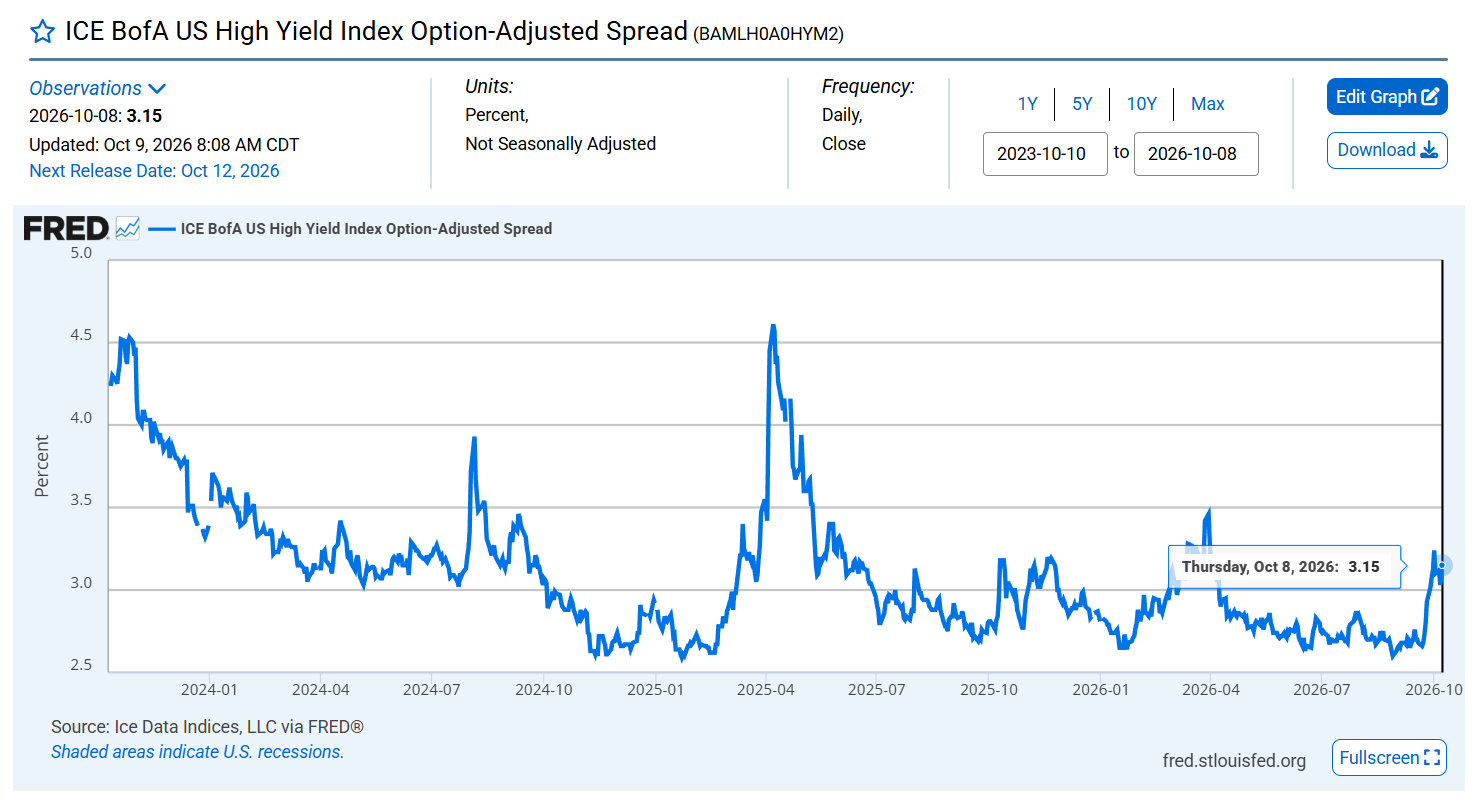
In everyday terms, this is extra that the shakiest companies have to pay over what the government does. So far, the move is mostly indigestion, since September was the busiest month of the year for new junk bond sales. But a climb through 4% would worry me a lot more; bond traders call that level 400. I think companies that need to refinance will start to feel squeezed, and that means Wall Street trouble could spill over to Main Street.
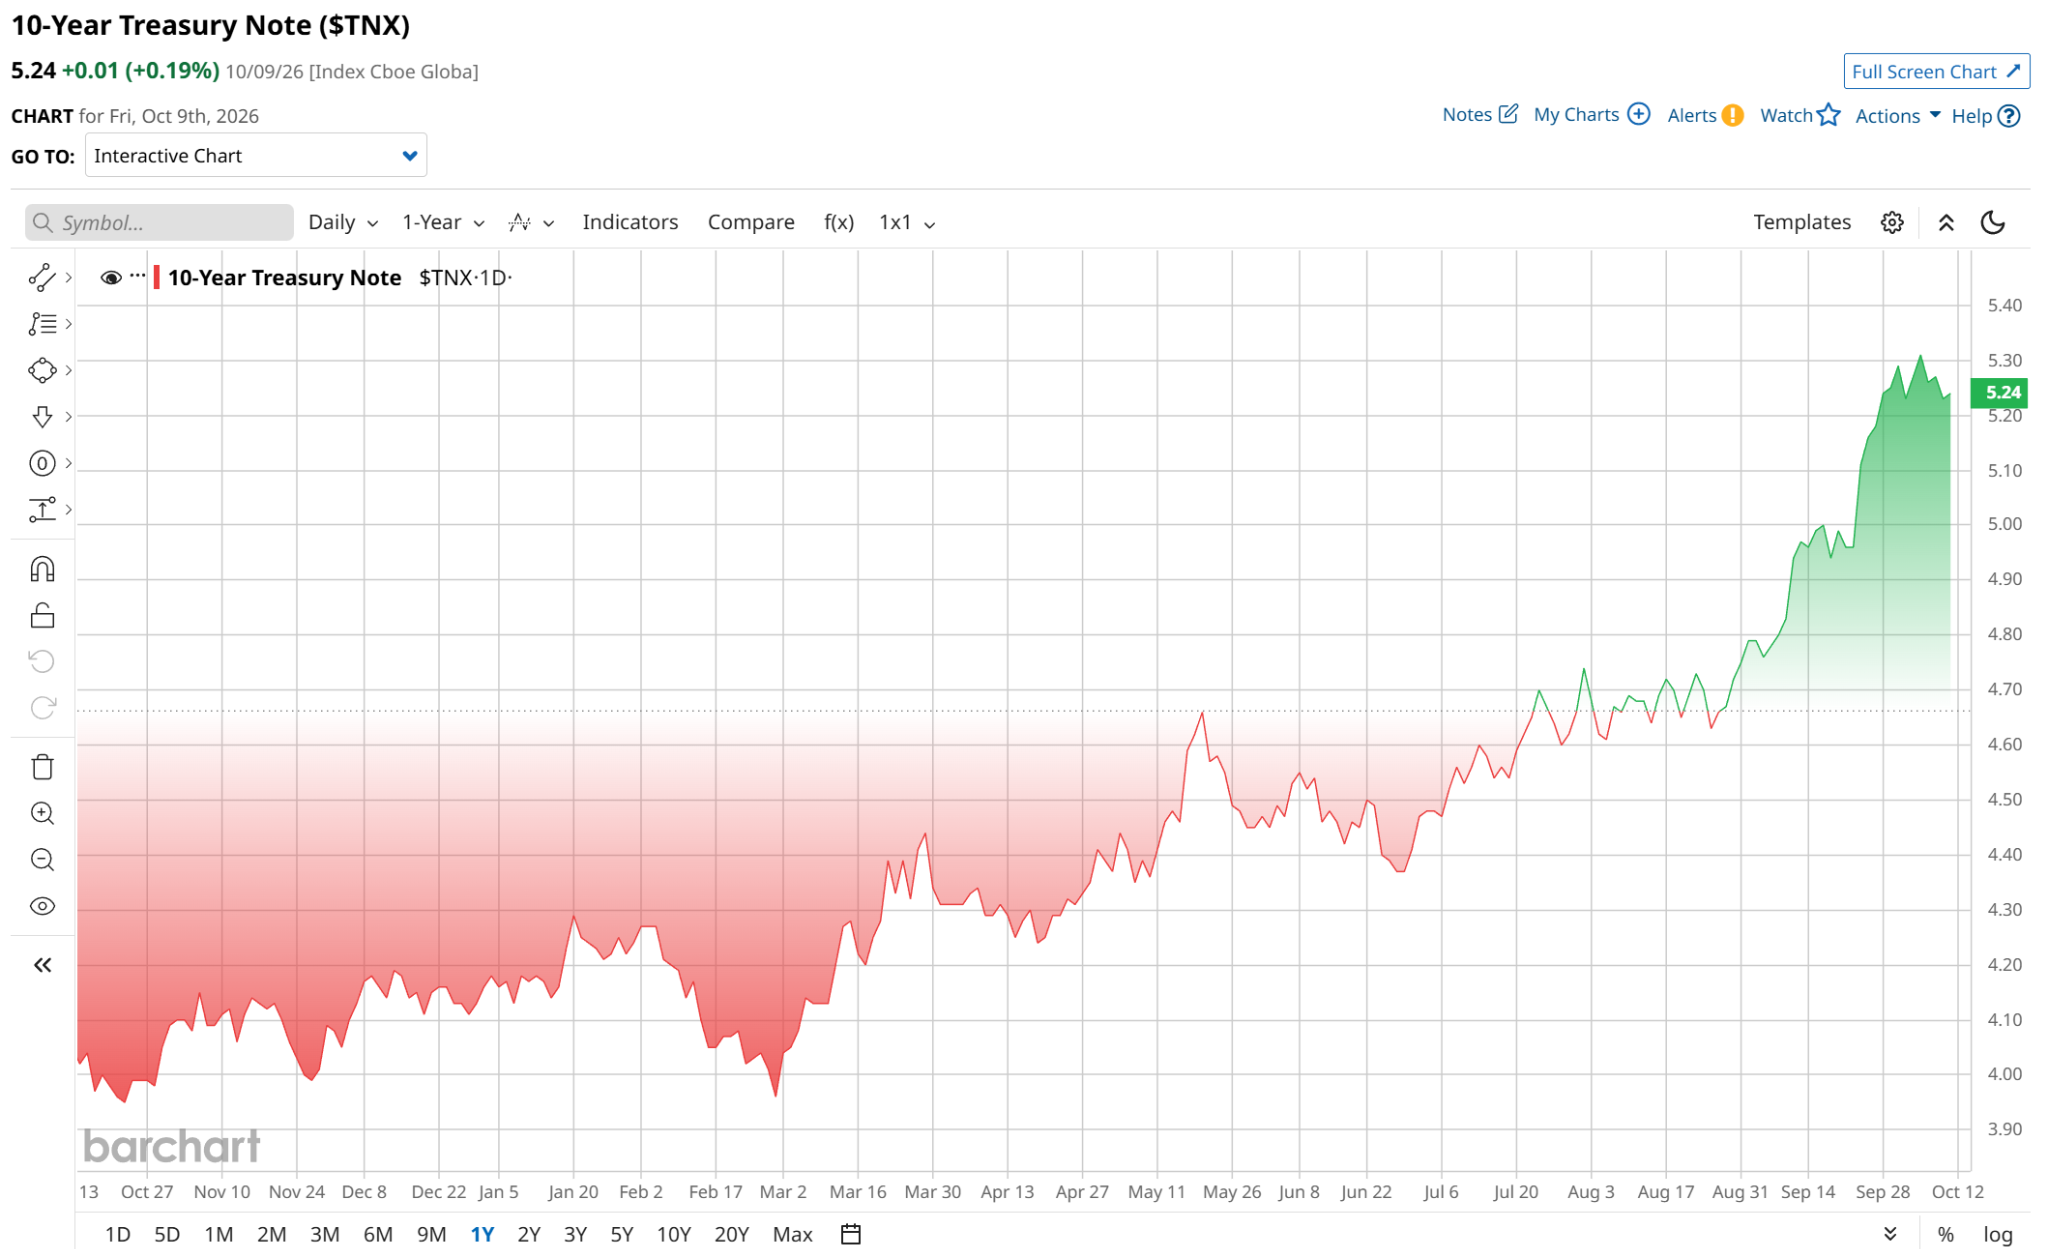
A significant part of what those companies pay depends on Treasury yields, so #2, rates, ranks right behind credit on my list. The U.S. 10-year Treasury Note ($TNX) yield reached 5.25% on Sept. 29 and touched about 5.34% during trading on Oct. 1. Since then, it has cooled to about 5.24%, but if it pushes past 5.34% again without stronger growth to explain it, I would take that as investors wanting more pay for inflation and deficits.
Increased borrowing costs tend to show up in hiring sooner or later, so I am watching jobs at #3 as well. Unemployment is 4.2% after staying between 4.1% and 4.3% since March, and employers added only 29,000 jobs in September against forecasts near 90,000. Funny enough, stocks rallied on the report because it lowers the odds of another hike. But personally, I wouldn't cheer too loudly, because weak hiring alongside 3% inflation looks like a mix that is hard for any central bank to fix with rates alone, and a jobless rate above 4.3% would break the range.
Next up is #4, earnings, since a softer job market would be easier to live with if profits keep coming through, and earnings season is right around the corner. I will be watching whether the 29.5% earnings growth estimate holds up and whether that growth shows up outside of chips and energy. If earnings disappoint, I think borrowed money could turn a dip into something more painful, as margin debt falling alongside prices would look a lot like forced selling.
Finally, I am keeping an eye on #5, the average stock, since the equal-weight S&P 500 (RSP) was on track for seven straight weekly losses as October began. Basically, this index weights every company equally, and a streak like that has shown up only in 2002 and 2022, both bear-market years. The average stock has perked up this week, but personally, I want to see that last before I relax.
I should know more soon, since September consumer prices are due Oct. 14, 2026, and the Fed meets Oct. 27 and 28, and again Dec. 8 and 9. Until then, here is where I land.
Why I'm Staying Invested While Keeping Expectations in Check
Is today's market a replay of 1929? I said at the top that the comparison is half right, and I think that half is the price tag and the borrowing, since both look a lot like the late 1920s. But the other half is where it breaks down for me, because the Fed has barely tapped the brakes this time, and banks have a safety net that did not exist back then.
For now, profits are still growing close to 30%, so I'll stay invested while keeping my expectations in check. That said, I wouldn't be shocked by a rough pullback along the way. None of my five warning signs have gone off yet, and if any do, I will say so right here. Until then, I plan to enjoy the rally with an eye on the bond market.
On the date of publication, Rick Orford did not have (either directly or indirectly) positions in any of the securities mentioned in this article. All information and data in this article is solely for informational purposes. For more information please view the Barchart Disclosure Policy here.