
Is ID Logistics Group (ENXTPA:IDL) Undervalued As Its Share Price Rebounds?
ID Logistics Group (ENXTPA:IDL) is back on investor radars after its latest share price move, with the stock closing at €326. That shift invites a closer look at how the logistics specialist is currently valued.
Over the past week ID Logistics Group has put together a 7-day share price return of 3.99% and a 1-month share price gain of 2.03%. However, the 90-day share price return is down 5.64% and the year-to-date share price performance has declined 19.21%, while the 3-year total shareholder return of 31.72% points to stronger momentum over a longer horizon.
Compare ID Logistics Group's recent swings with a curated set of logistics and transport peers screened for resilient balance sheets and cash flows using the list of solid balance sheet and fundamentals (204 results).
ID Logistics Group now trades well below both analyst targets and one intrinsic value estimate. The recent rebound throws that gap into sharper relief and raises a key question: Does the current price capture fair worth or signal a valuation disconnect?
Price-to-Earnings of 31.8x: Is it justified?
On simple earnings math, ID Logistics Group carries a rich tag. The stock trades on a P/E of 31.8x, which is being applied to a share price of €326 that has declined 19.21% year to date and 13.76% over the past twelve months.
The P/E ratio compares what investors pay today for each euro of current earnings. For a contract logistics specialist such as ID Logistics Group, this gauge often reflects how the market weighs recent profit trends, the consistency of cash generation, and the perceived resilience of its €4.06b revenue base across sectors like FMCG, e-commerce, healthcare, and retail.
IDL's earnings profile gives that high multiple some context. Net income of €67.03m on €4,059.91m of revenue implies a thin 1.7% net margin, and that margin is described as lower than the prior year. Even so, the business reports high quality earnings, 14.4% annual profit growth over five years, and 14.8% earnings growth over the past year, which exceeded the Logistics industry result that declined 9.6%. Earnings are also forecast to grow 19.6% per year, with revenue expected to advance 8.8% annually, both ahead of the French market benchmarks referenced in the data. That mix of slim margins and solid growth means the market may be paying up for expansion and execution rather than current profitability.
The comparison set points to stretch. ID Logistics Group is described as expensive on a 31.8x P/E relative to the European Logistics industry average of 21.5x and a peer average of 15.5x. The current ratio is also roughly double an estimated fair P/E of 16x that our data suggests the market could move towards if sentiment or expectations cool.
Explore the SWS fair ratio for ID Logistics Group.
Result: Price-to-Earnings of 31.8x (OVERVALUED)
Still, ID Logistics Group relies on low net margins and concentrated trucking exposure, so any hit to pricing or volumes could pressure that premium P/E story.
Find out about the key risks to this ID Logistics Group narrative.
Another view on ID Logistics Group’s value
The earnings multiple paints ID Logistics Group as expensive. The SWS DCF model tells a very different story. It pegs the future cash flow value at about €1,264 per share versus today’s €326, which flags deep undervaluation on that framework. Which lens do you trust more?
Look into how the SWS DCF model arrives at its fair value.
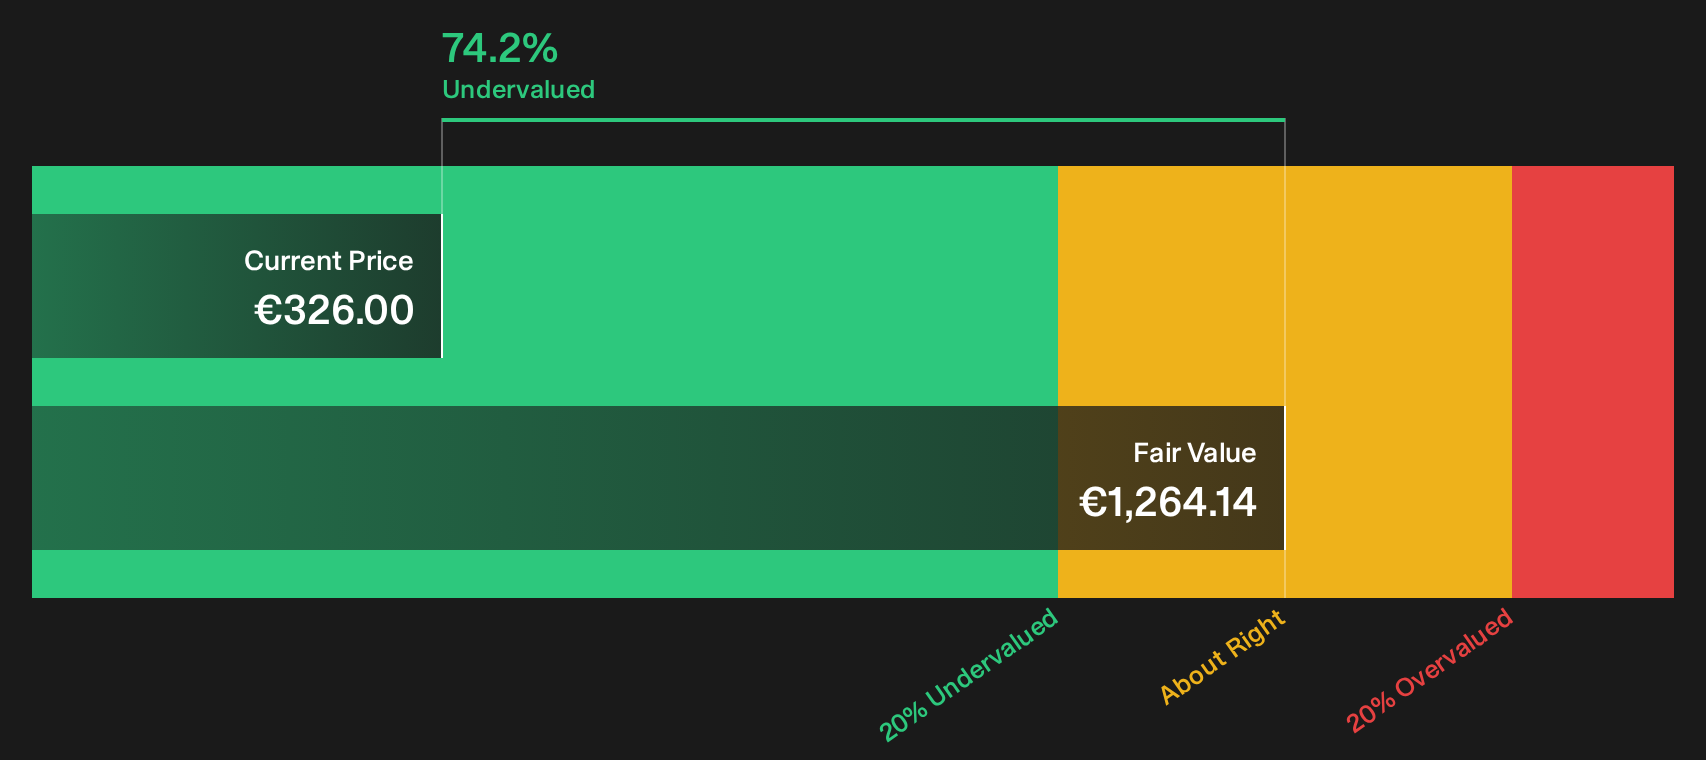
Simply Wall St performs a discounted cash flow (DCF) on every stock in the world every day (check out ID Logistics Group for example). We show the entire calculation in full. You can track the result in your watchlist or portfolio and be alerted when this changes, or use our stock screener to discover 172 high quality undervalued stocks. If you save a screener we even alert you when new companies match - so you never miss a potential opportunity.
Next Steps
If the mixed signals around ID Logistics Group leave you torn, act while the data is fresh and test the numbers yourself. To see what optimism in the data looks like in one place, review the 4 key rewards.
Looking for more investment ideas beyond ID Logistics Group?
Do not stop at one stock. Broaden your watchlist with fresh ideas tailored to different goals, risk levels, and income needs using the Simply Wall Street Screener.
- Target potential mispricing by reviewing companies screened as 172 high quality undervalued stocks and see which ones match your return and risk comfort zone.
- Strengthen the income side of your portfolio by checking out 221 dividend fortresses that focus on higher-yield payouts backed by data driven checks.
- Prioritise resilience in tough markets and keep capital better protected by starting with 222 resilient stocks with low risk scores.
This article by Simply Wall St is general in nature. We provide commentary based on historical data and analyst forecasts only using an unbiased methodology and our articles are not intended to be financial advice. It does not constitute a recommendation to buy or sell any stock, and does not take account of your objectives, or your financial situation. We aim to bring you long-term focused analysis driven by fundamental data. Note that our analysis may not factor in the latest price-sensitive company announcements or qualitative material. Simply Wall St has no position in any stocks mentioned.
Have feedback on this article? Concerned about the content? Get in touch with us directly. Alternatively, email editorial-team@simplywallst.com