
PowerXInc (TSE:485A) Stock Looks Rich Following Its 128% Year To Date Run
PowerXInc has surged this year, putting the spotlight on whether the current share price lines up with what the business is actually generating in sales. With such a sharp move behind it, the core question for anyone looking at the stock is how those revenues square with the valuation now placed on the company.
- PowerXInc is up 127.9% year to date, which puts a lot of weight on the idea that its revenue base can justify a far higher price tag than at the start of the year.
- The business model leans on converting equipment sales into a durable revenue stream, which can support a richer price to sales profile if buyers believe that demand and pricing are resilient over time.
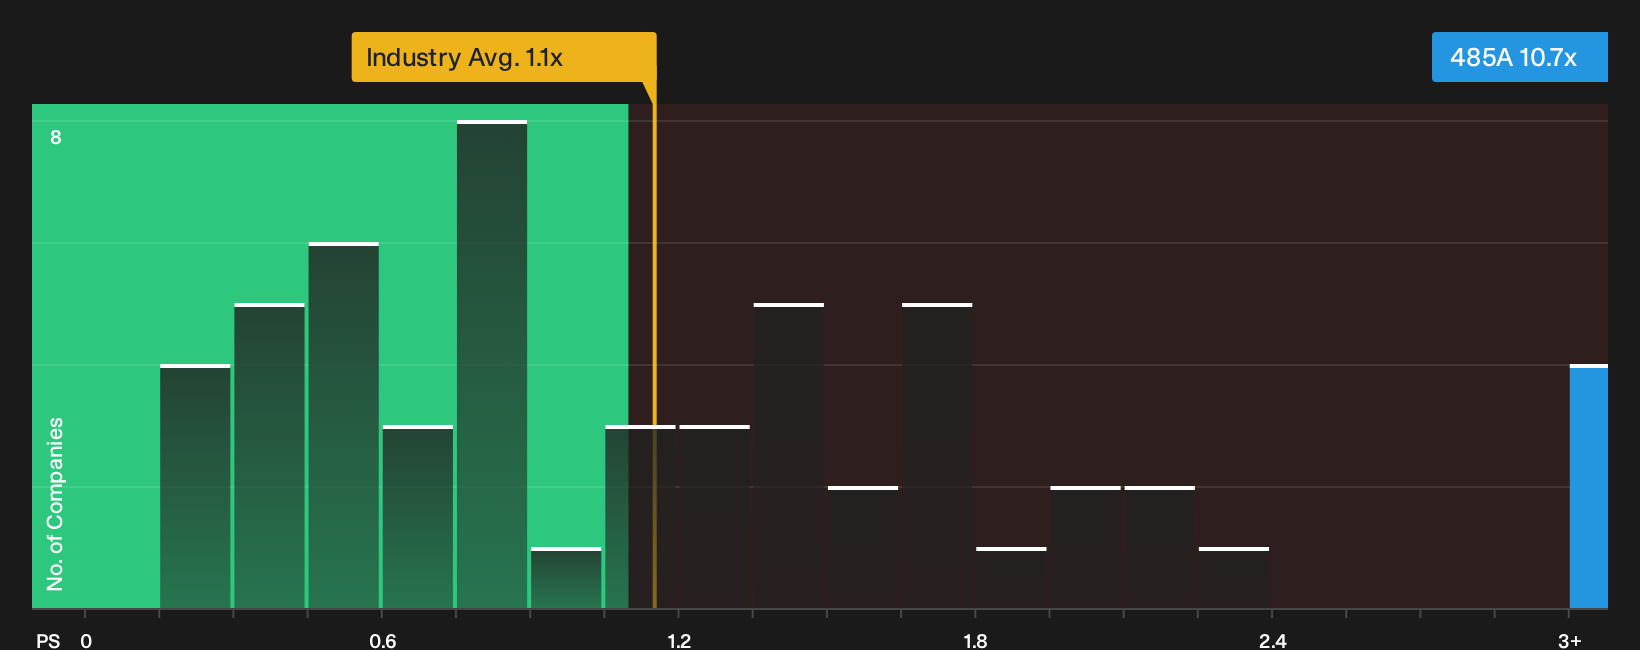
- PowerXInc's multiple only means something next to the competition. See how PowerXInc's 10.7x P/S compares with its peers.
The issue now is whether the valuation that investors are paying for PowerXInc stock is adequately supported by its sales relative to the industry average.
If you are comparing PowerXInc on its sales against the wider sector, it can help to evaluate that side by side with 43 power grid technology and infrastructure stocks
Is PowerXInc Getting Expensive on Sales?
P/S is a useful lens for PowerXInc because the market is clearly paying up for its revenue rather than its current cash generation. On this measure, the stock trades at about 10.7x sales, compared with an industry average of roughly 1.1x for Electrical peers.
That gap is very wide, and it indicates investors are assigning a much richer value to each yen of PowerXInc’s turnover than to the typical company in the sector. The premium suggests expectations around the quality, durability or growth potential of those sales are far higher than for the peer group. You therefore need to be comfortable that the business model and risk profile justify paying such a steep revenue multiple before leaning on this P/S as support for the current share price. Explore the numbers behind PowerXInc's P/S valuation.
The PowerXInc Narrative: What Would Justify Today's Price?
Narratives on Simply Wall St pick up where this pricing puzzle for PowerXInc leaves off and explain what kind of future path for growth, margins and earnings would need to occur for the shares to appear meaningfully cheaper or more expensive than they do today based on the P/S alone. Each scenario sets out the assumptions behind its idea of fair value in plain terms so you can compare those expectations with the company’s actual results as they are reported over time.
A clear, written view on PowerXInc that ties its valuation back to specific revenue, margin and execution assumptions gives you a concrete benchmark to test against as fresh results and updates come through. Putting those numbers on paper now turns a loose story about the stock into a set of expectations you can track and either gain confidence in or actively challenge over time.
Share your own Narrative for PowerXInc and set out the assumptions behind your valuation.
Before You Decide On PowerXInc, One Big Loose End Remains
Valuation only tells part of the PowerXInc story, since the research checks behind this analysis also highlight specific risk signals that could change how you weigh the whole opportunity. Take a closer look at 3 warning signs (2 major) before settling on a valuation.
This article by Simply Wall St is general in nature. We provide commentary based on historical data and analyst forecasts only using an unbiased methodology and our articles are not intended to be financial advice. It does not constitute a recommendation to buy or sell any stock, and does not take account of your objectives, or your financial situation. We aim to bring you long-term focused analysis driven by fundamental data. Note that our analysis may not factor in the latest price-sensitive company announcements or qualitative material. Simply Wall St has no position in any stocks mentioned.
Have feedback on this article? Concerned about the content? Get in touch with us directly. Alternatively, email editorial-team@simplywallst.com