
Is MKS (MKSI) Cheap As AI Demand And Margin Hopes Face A Pullback?
MKS (MKSI) has drawn attention after its recent share performance, with the stock closing at US$260.38 and showing mixed returns over the past week, month, and past 3 months.
Recent trading tells a mixed story for MKS. The share price has pulled back over the past day, week, month, and quarter, with a 90 day share price return down 29.36%. However, long term holders have seen a 94.75% total shareholder return over the past year, suggesting earlier momentum remains influential even as shorter term sentiment cools.
Scan beyond MKS and spot other semiconductor players showing sharp momentum reversals with our curated list of 92 AI infrastructure stocks.
MKS looks like a solid semiconductor supplier with US$4.3b in revenue and US$439 million in net income, yet the share price has just dropped hard over 3 months. Is that business strength already fully reflected in today's US$260.38 price, or not?
Most Popular MKS Narrative: 37% Undervalued
The most followed narrative values MKS at $410.86 per share, well above the recent $260.38 close. This frames the recent pullback very differently compared with looking at the price chart alone. That fair value view leans heavily on AI demand, higher margin recurring revenue and new capacity coming online.
The deepening integration of advanced materials and chemistry equipment within MKS, supported by record chemistry equipment orders for several quarters and a rising share of AI related chemistry revenue, increases the opportunity for tools plus consumables cross selling and can support both revenue growth and higher gross margins.
See why 15 investors see MKS as 37% undervalued.
Result: Fair Value of $410.86 (UNDERVALUED)
Still, the bullish MKS story depends on AI related demand holding up and on new Malaysia and Guangzhou capacity not dragging margins below current expectations.
Find out about the key risks to this MKS narrative.
Another View On MKS Valuation
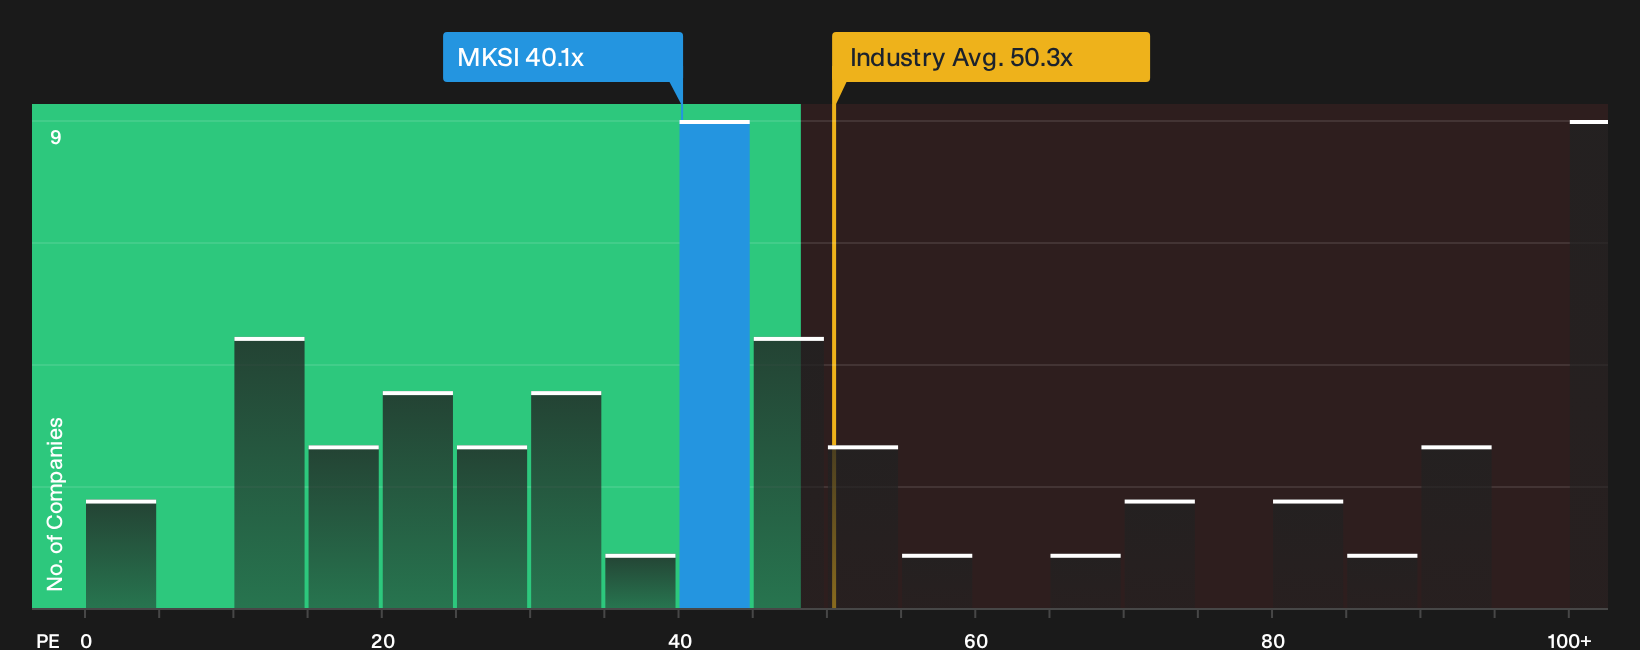
The bullish fair value narrative around MKS leans on long term earnings forecasts and analyst targets. A simpler cross check looks at today’s P/E of 40.1x against the US Semiconductor industry at 50.3x and a fair ratio of 39.3x, which points to only a slight premium and limited valuation cushion.
That narrow gap suggests the share price does not leave a lot of room if growth or margins underwhelm, even though it still prices MKS below many peers on earnings. For a closer look at how this earnings based view compares with the fair ratio and sector, See what the numbers say about this price — find out in our valuation breakdown..
Simply Wall St performs a discounted cash flow (DCF) on every stock in the world every day (check out MKS for example). We show the entire calculation in full. You can track the result in your watchlist or portfolio and be alerted when this changes, or use our stock screener to discover 27 high quality undervalued stocks. If you save a screener we even alert you when new companies match - so you never miss a potential opportunity.
Next Steps
Mixed signals on MKS can be confusing, so move quickly from reading opinions to stress testing the numbers yourself and weighing both sides of the story. To see how those competing views stack up in one place, review the 3 key rewards and 1 important warning sign.
Looking for more MKS investment ideas?
If you stop with MKS, you risk leaving some of the most interesting opportunities untouched. Broaden your watchlist and give yourself more options.
- Target potential mispricings by running through our 27 high quality undervalued stocks that line up strong fundamentals with compressed expectations.
- Seek more consistent income streams by scanning for 8 dividend fortresses that aim to keep cash coming in while you wait.
- Reduce portfolio stress by filtering for 31 resilient stocks with low risk scores that score well on resilience instead of adrenaline.
This article by Simply Wall St is general in nature. We provide commentary based on historical data and analyst forecasts only using an unbiased methodology and our articles are not intended to be financial advice. It does not constitute a recommendation to buy or sell any stock, and does not take account of your objectives, or your financial situation. We aim to bring you long-term focused analysis driven by fundamental data. Note that our analysis may not factor in the latest price-sensitive company announcements or qualitative material. Simply Wall St has no position in any stocks mentioned.
Have feedback on this article? Concerned about the content? Get in touch with us directly. Alternatively, email editorial-team@simplywallst.com